
Quantitative trading is a way of trading in which every decision comes from rules you can write down and test on data: when to enter, how much to buy, where to exit. A quant model turns a market idea, such as "trends tend to continue" or "sharp drops tend to bounce", into exact rules, checks them against historical prices including costs, and only then trades them, often automatically.
This guide explains how quant models work, the main quantitative trading strategies used in crypto, and how to build and test one step by step. It includes a worked example: two classic quant models run on BTC and ETH from 2020 to October 2026, with the rules picked on 2020 to 2023 and checked on data the rules never saw. Everything here is educational and not financial advice.
- Rules, not opinions. A quant strategy is defined precisely enough that a computer could trade it and two people would place the same trades.
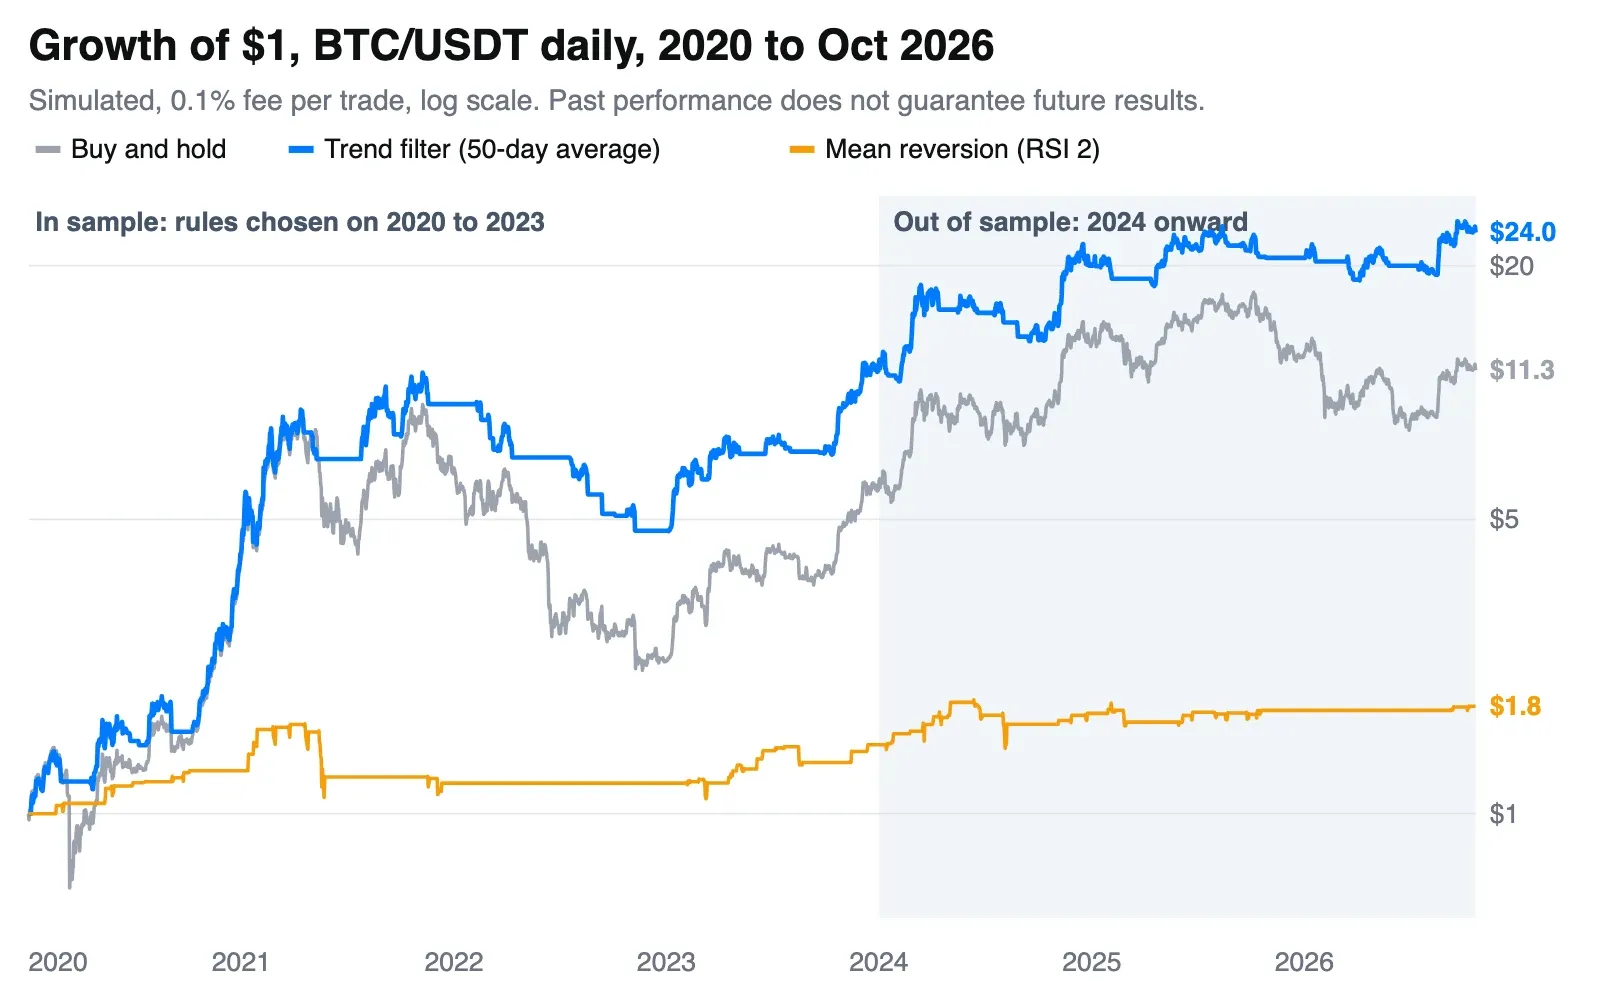
- The test is out of sample. Rules tuned on past data always look good on that data. Our trend model earned 83% a year on BTC in 2020 to 2023 and 29% a year afterwards.
- A trend filter mostly cut the drawdowns. On 2024 to 2026 data, a 50-day moving-average filter beat holding both coins and roughly halved the deepest fall (BTC: −27% instead of −53%).
- Win rate is not profit. Our mean reversion model won 55% to 77% of its trades and still made only 3% to 11% a year.
- Retail quant fits candle timeframes. High-frequency trading and market making need exchange-grade infrastructure. Trend, mean reversion and momentum models on hourly or daily candles do not.
What Is Quantitative Trading?
Quantitative trading, or quant trading, uses data, statistics and fixed rules to decide trades instead of judgment in the moment. The trader's work moves earlier in the process: forming a hypothesis, collecting data, writing rules and testing them. Once the rules pass, execution is mechanical, and in crypto it is usually automated through exchange APIs.
It overlaps with two terms people often mix up:
| Quantitative trading | Algorithmic trading | Discretionary trading | |
|---|---|---|---|
| Decides | What to trade and when, from tested rules | How an order is executed by code | The trader, case by case |
| Core skill | Research, statistics, testing | Automation and execution | Reading the market |
| Can be tested on history? | Yes, by design | The execution logic, yes | Only loosely |
| Example | Buy when price closes above its 50-day average | Split a large order into small pieces | "This chart looks ready to break out" |
Most quant strategies are executed algorithmically, but an algorithm does not make a strategy quantitative: a bot that follows someone's hunches is still discretionary. For the execution side, see our guide to algorithmic trading strategies.
What Is a Quant Model?
A quant model is the complete, written set of rules a strategy follows. Whatever the strategy, it has the same five parts:
- Universe: which markets it trades, for example BTC/USDT and ETH/USDT on one exchange, or the 50 largest coins.
- Data: what it reads, such as daily candles, volume, funding rates, order book depth or on-chain flows.
- Signal: the condition that says "trade now", for example the close crossing above a moving average or an RSI reading below 10.
- Risk and sizing: how much to put on each trade and when to cut it, such as a fixed share of the account and a stop loss.
- Execution: how and when orders are placed, for example at the next candle's open with a market order, and what fees and slippage that costs.
If any of the five is left to judgment, the model cannot be tested honestly, because the backtest will quietly assume the best judgment every time.
Quantitative Trading Strategies Used in Crypto
Most quant strategies fall into a handful of families. The table shows what each needs, and which are realistic for an individual trader.
| Strategy | The idea | Typical data | Realistic for individuals? |
|---|---|---|---|
| Trend following | Prices that are rising tend to keep rising for a while; be in the market only while a trend is up | Candles, moving averages, breakouts | Yes, on 4-hour or daily candles |
| Mean reversion | Sharp short-term moves away from the average tend to snap back | Candles, RSI, Bollinger Bands | Yes, with care about costs |
| Momentum (cross-sectional) | Coins that outperformed recently keep outperforming; hold the strongest of a basket | Returns across many coins | Yes, with a broad exchange list |
| Pairs and statistical arbitrage | Two related coins drift apart and then converge; trade the spread | Prices of both, correlation | Possible, needs shorting or futures |
| Cross-exchange arbitrage | The same coin trades at different prices on two exchanges | Live prices, fees, transfer times | Hard: gaps are small and close fast |
| Funding and basis trades | Collect the funding rate or the gap between futures and spot | Funding rates, futures prices | Possible, with exchange and liquidation risk |
| Market making | Quote both sides of the order book and earn the spread | Order book, trade flow | Rarely: needs speed and inventory risk control |
| High-frequency trading | Exploit tiny, short-lived inefficiencies thousands of times a day | Tick data, co-located servers | No: built by firms with dedicated infrastructure |
Scroll the table sideways on small screens.
Two related guides go deeper on single families: the crypto arbitrage guide and our trend trading strategy article.
How to Build a Quant Trading Strategy, Step by Step
- Start with a hypothesis you can explain. "BTC tends to keep moving in the direction of its 50-day trend" is testable. "Find whatever indicator settings made the most money" is not a hypothesis; it is curve fitting.
- Get clean data. Use exchange candles for the markets you will actually trade, from the venue you will trade on, and enough history to include a bull market, a bear market and a range.
- Write every rule down. Signal, entry timing, exit, position size and stop. If a rule says "when it looks strong", it is not finished.
- Backtest with costs. Include trading fees and realistic slippage, and trade at the next candle after the signal, not at the close that produced it. See backtesting and optimization.
- Split the data and test out of sample. Choose settings on an older period, then run them unchanged on a later period. Walk-forward testing repeats this across several windows.
- Paper trade it live. A few weeks on a paper trading account shows execution problems no backtest can: missed fills, API limits and your own urge to override the rules.
- Go live small, then monitor. Start with a fraction of the planned size, compare live results with the backtest, and decide in advance what drawdown means the model is broken.
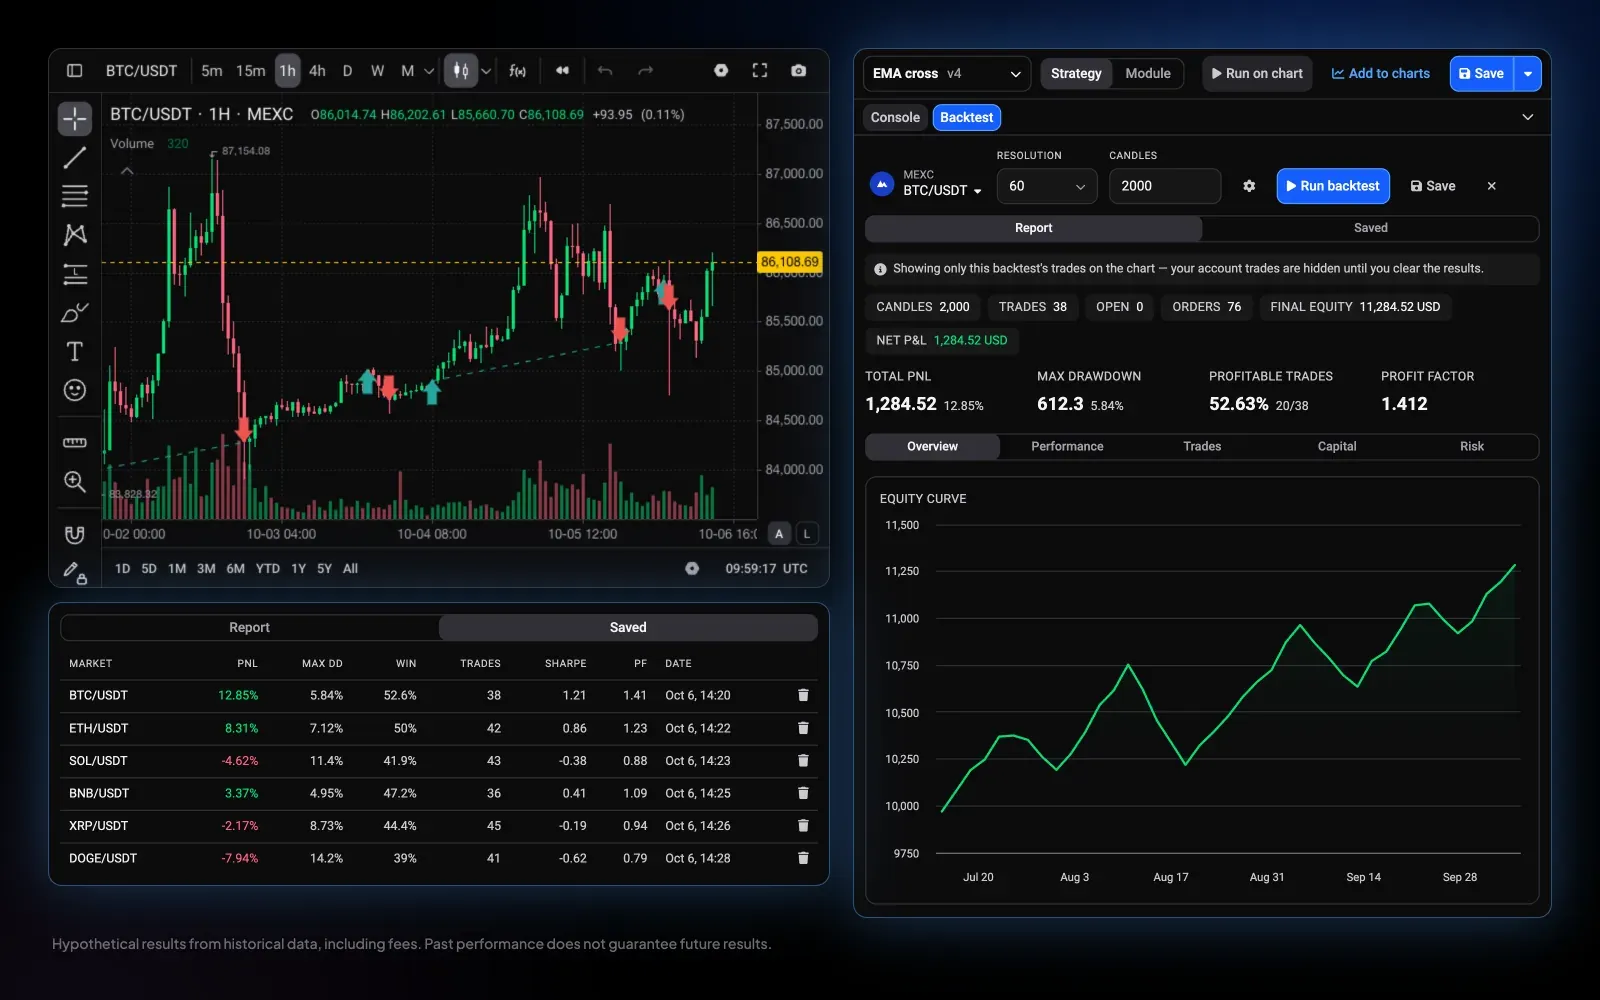
Turn a trading idea into tested rules: write it as a script in Altrady Charts, backtest it on several markets, and run it on paper before real funds.
Backtests are simulated; past performance does not guarantee future results.
Example: Two Quant Models Tested on BTC and ETH
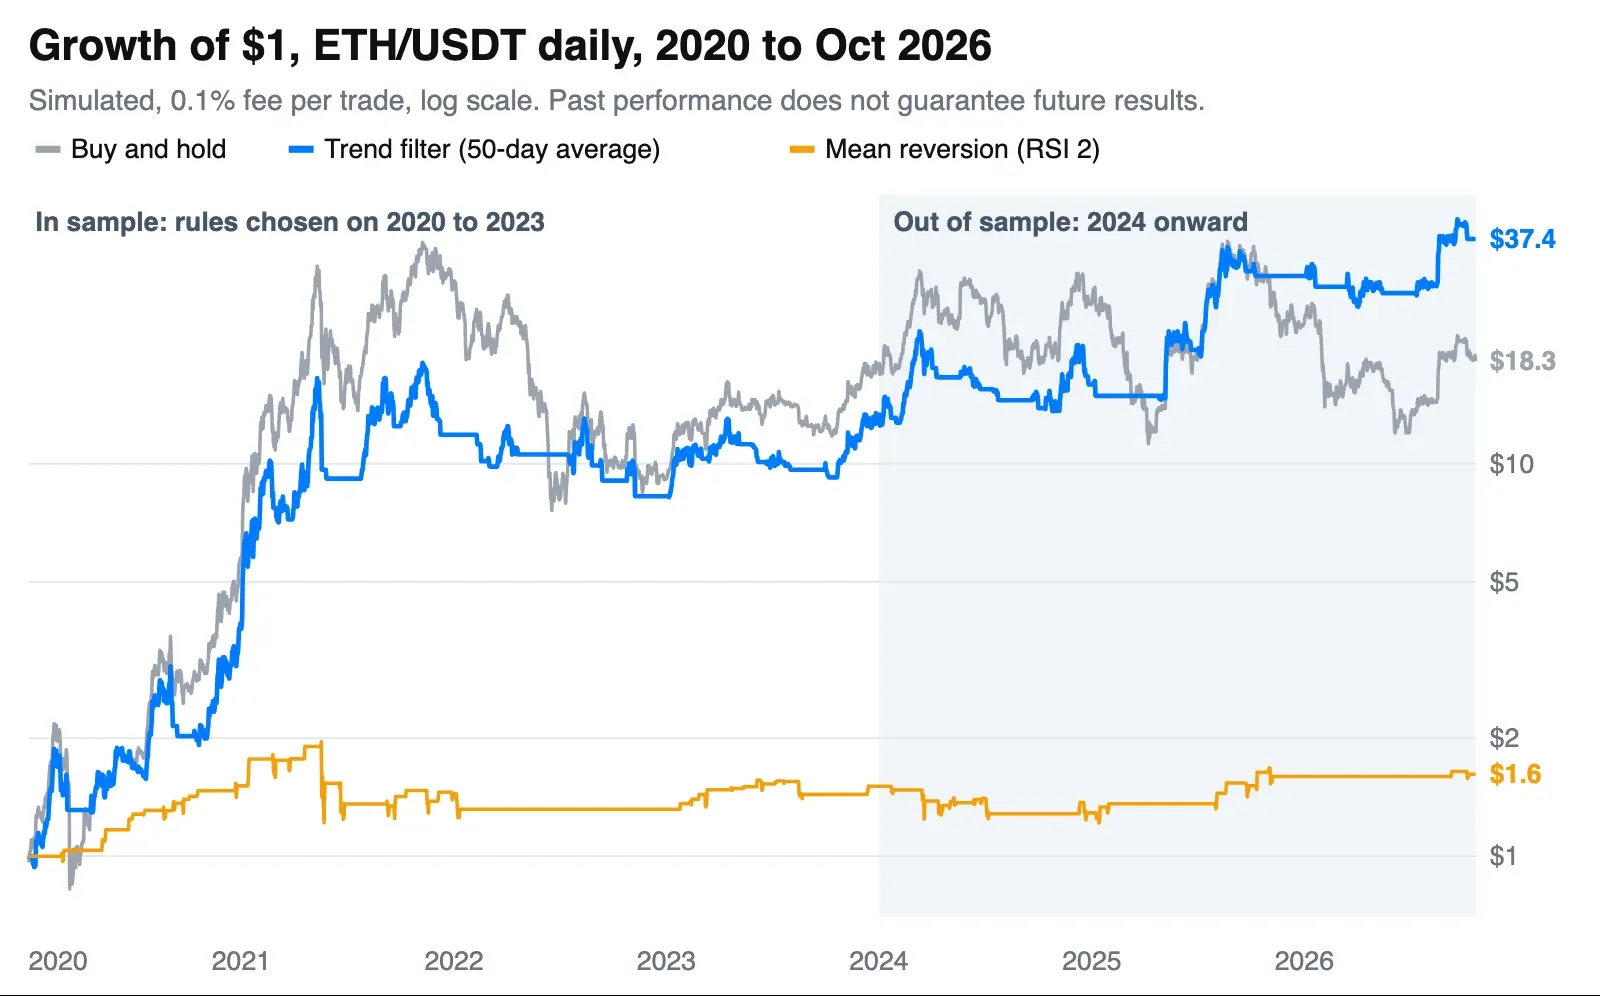
To show the process end to end, we ran two textbook quant models on Binance BTC/USDT and ETH/USDT daily candles from 1 January 2020 to 22 October 2026. This is a teaching example, not a recommended strategy: results are simulated, and past performance does not guarantee future results.
The rules
- Trend filter: hold the coin while the daily close is above its simple moving average (SMA); otherwise hold cash. We tried 50, 100, 150 and 200 days on 2020 to 2023 only. The 50-day average scored best on both coins, so that is the version tested afterwards.
- Mean reversion: buy when the 2-day RSI closes below 10 while price is above its 200-day average; sell when the close rises above the 5-day average. These rules follow a well-known published template and were not tuned.
- Benchmark: buy and hold.
- Assumptions: signals on the daily close, trades at the next day's open, 0.1% fee per trade, no slippage, no leverage, long only, cash earns nothing. 2019 data was used only to warm up the averages.
The results
| Model | Period | Return per year | Deepest drawdown | Trades | Winning trades |
|---|---|---|---|---|---|
| BTC buy and hold | In sample | 55.7% | −76.6% | 1 | – |
| BTC trend filter (50-day) | In sample | 83.2% | −58.0% | 33 | 30% |
| BTC mean reversion | In sample | 9.9% | −33.6% | 34 | 76% |
| BTC buy and hold | Out of sample | 24.3% | −53.0% | 1 | – |
| BTC trend filter (50-day) | Out of sample | 28.9% | −26.5% | 34 | 24% |
| BTC mean reversion | Out of sample | 7.8% | −23.2% | 27 | 67% |
| ETH buy and hold | In sample | 104.5% | −79.3% | 1 | – |
| ETH trend filter (50-day) | In sample | 89.7% | −54.6% | 43 | 28% |
| ETH mean reversion | In sample | 10.8% | −37.9% | 37 | 70% |
| ETH buy and hold | Out of sample | 0.5% | −67.6% | 1 | – |
| ETH trend filter (50-day) | Out of sample | 44.4% | −37.5% | 22 | 32% |
| ETH mean reversion | Out of sample | 2.5% | −19.4% | 20 | 55% |
What the example teaches
- Results shrink out of sample. The BTC trend filter fell from 83% a year to 29% a year once it met data it was not tuned on. Plan for live results well below the backtest.
- The settings were fragile. On 2020 to 2023 the 50-day filter returned 83% a year on BTC, but the 200-day filter only 43%. A model whose result depends that much on one number needs more testing before real money.
- The filter's value was in the drawdowns. It was in the market only about 55% of the time and lost most of its trades, yet it avoided the deepest declines, which is what kept it ahead after 2024.
- A filter can lag a strong bull run. In ETH's 2020 to 2021 rally, buy and hold beat the filter by a wide margin. No rule wins in every regime.
- Win rate misleads. Mean reversion won two trades out of three but was invested only 8% to 10% of the time, so it earned little. Judge a model on return per unit of risk, not on how often it wins.
What this test does not cover: one data split, two coins, no slippage, no taxes. Those are exactly the checks a real quant process adds next, with more markets, walk-forward windows and paper trading.
Risks and Common Mistakes
- Overfitting. Trying hundreds of settings until one looks great finds noise, not an edge. Keep rules simple and test on unseen data.
- Look-ahead bias. Using information that was not available at the time, such as trading at the close that created the signal. Trade at the next candle.
- Survivorship bias. Testing only coins that still exist today ignores the ones that went to zero.
- Ignoring costs. Fees, slippage and funding turn many high-turnover strategies from profitable to losing.
- Regime change. A model built in a bull market can fail in a range. Decide in advance what drawdown means "stop and review".
- Operational and exchange risk. API outages, wrong order sizes and exchange failures are real. Use API keys without withdrawal rights and size positions so one failure is survivable. See how to calculate position size.
Quantitative Trading for Beginners: What You Need
- Basic statistics. Averages, volatility, drawdown and the difference between a lucky result and a repeatable one.
- A way to express rules. Python is the most common language for research. Rule builders and scripting inside a trading platform cover many strategies without a full programming setup.
- Clean data and a backtester that includes fees and trades at the next candle. Our comparison of crypto backtesting platforms covers the options.
- A path to execution. Paper trading first, then automation through a bot or the exchange API.
- A trading journal. Record every live trade against what the model expected, so you notice drift early.
Running Quant Strategies With Altrady
Altrady covers the full loop for rule-based strategies on candle timeframes, from idea to automated orders on your connected exchanges:
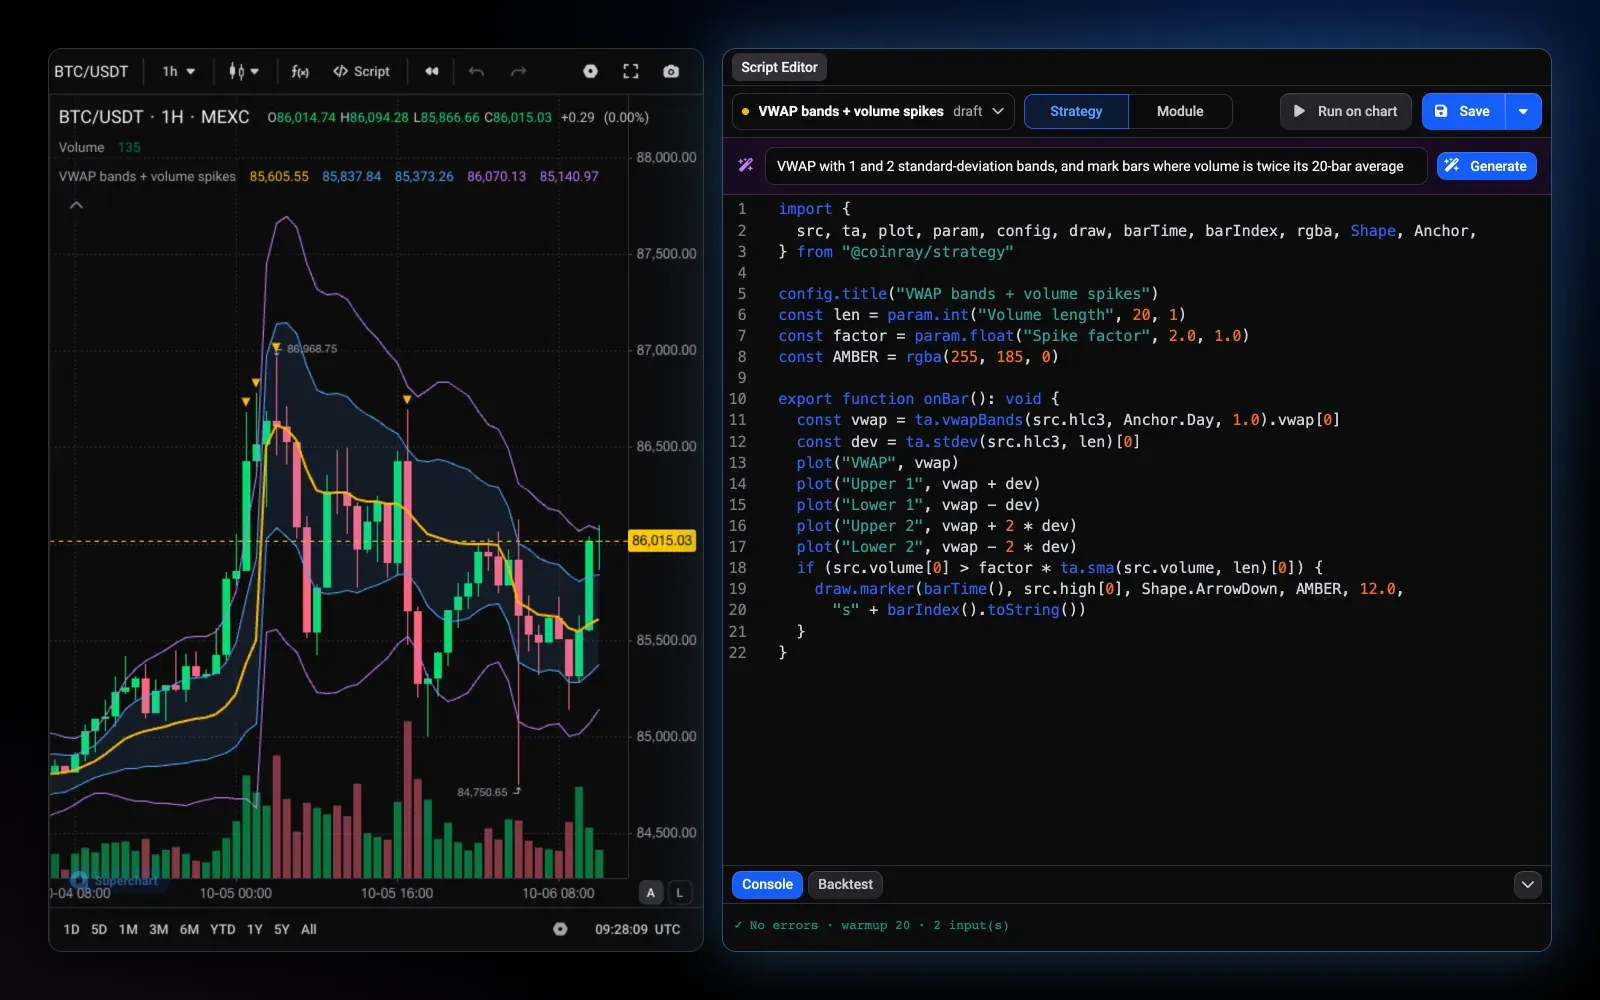
- Write the rules. In Altrady Charts, strategies are TypeScript scripts, and all 112 built-in indicators are readable scripts you can copy and change. Describe an idea in plain words and AI drafts the script, or paste Pine Script v5 or v6 and convert it.
- Backtest across markets. Run one strategy on several markets and compare results before putting capital behind it. Use replay mode to step through history candle by candle.
- Scan for signals. The technical analysis screener chains 100+ indicators with AND/OR rules across every market on your exchanges and alerts you within seconds of a match.
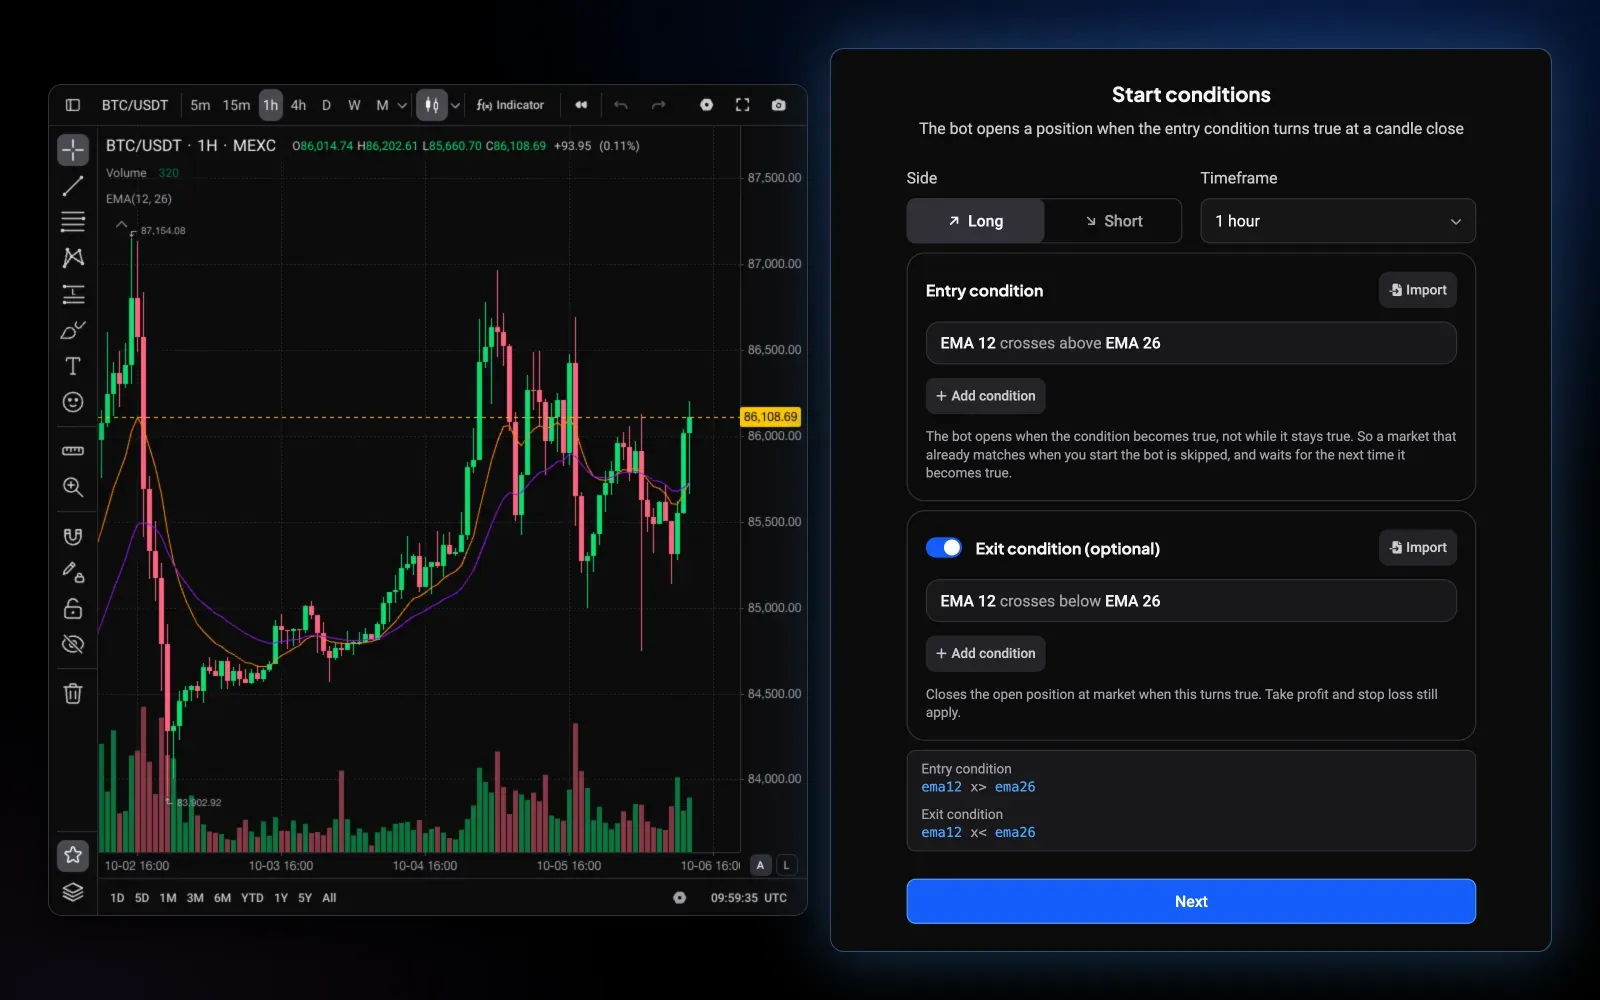
- Automate execution. Chart conditions can become Signal Bot triggers that open a position when the condition turns true at a candle close, with take profit and stop loss handled by the bot.
- Rehearse and review. Test live on paper trading with simulated funds, then review each closed trade in the trading journal.
- Research with AI. The Altrady MCP server lets Claude read your positions and candles, scan markets and prepare trades, with every order waiting for your approval.
Where Altrady does not fit: it is not built for high-frequency trading, market making or co-located execution, and it is a software provider, not a broker. It connects to your exchange accounts through API keys without withdrawal rights, so your funds stay on the exchange.
Frequently Asked Questions
What is quantitative trading in simple terms?
Quantitative trading means trading by rules that are written down and tested on historical data before they are used. The rules decide what to buy, when, how much and when to exit, so two people following the same model would place the same trades.
Is quantitative trading profitable?
It can be, but there is no guarantee. Most strategies that look profitable in a backtest earn less live, as our BTC trend example shows: 83% a year in the tuning period and 29% a year afterwards. Costs, overfitting and changing market conditions decide whether a model keeps working.
What is the difference between quantitative and algorithmic trading?
Quantitative trading is about deciding what to trade from tested rules; algorithmic trading is about executing orders with code. Most quant strategies are executed algorithmically, but a bot that follows untested hunches is algorithmic without being quantitative.
What is a quant model?
A quant model is the full rule set of a strategy: the markets it trades, the data it reads, the signal that triggers a trade, the sizing and risk rules, and how orders are executed. Every part is precise enough to be backtested.
Can you do quantitative trading in crypto?
Yes. Crypto trades around the clock, exchange data is easy to get, and most exchanges offer APIs for automated orders. Trend, mean reversion and momentum models on hourly or daily candles are realistic for individuals; high-frequency trading and market making are not.
Do you need to know Python for quant trading?
Python is the most common research language, but it is not required to start. Platforms such as Altrady let you write strategies as scripts with AI help, convert Pine Script, backtest across markets and automate the result with a bot.
What are the most common quantitative trading strategies?
Trend following, mean reversion, cross-sectional momentum, pairs or statistical arbitrage, cross-exchange arbitrage, funding and basis trades, market making and high-frequency trading. The first three are the most accessible for individual crypto traders.
How much money do you need to start quant trading?
You can research and paper trade with no capital at all. When you go live, start with an amount you can afford to lose and small position sizes, because live results often differ from the backtest.
How do you avoid overfitting a quant strategy?
Keep the rules simple, limit how many settings you try, and always test on data that was not used to choose the settings. Then paper trade the model live before risking real money.
Try Altrady for Quant Trading
Build rules in Altrady Charts or the TA screener, backtest them across markets, and let a Signal Bot trade them with your own take profit and stop loss. Start on a paper account.
No credit card required. Trading crypto involves risk; past performance does not guarantee future results.