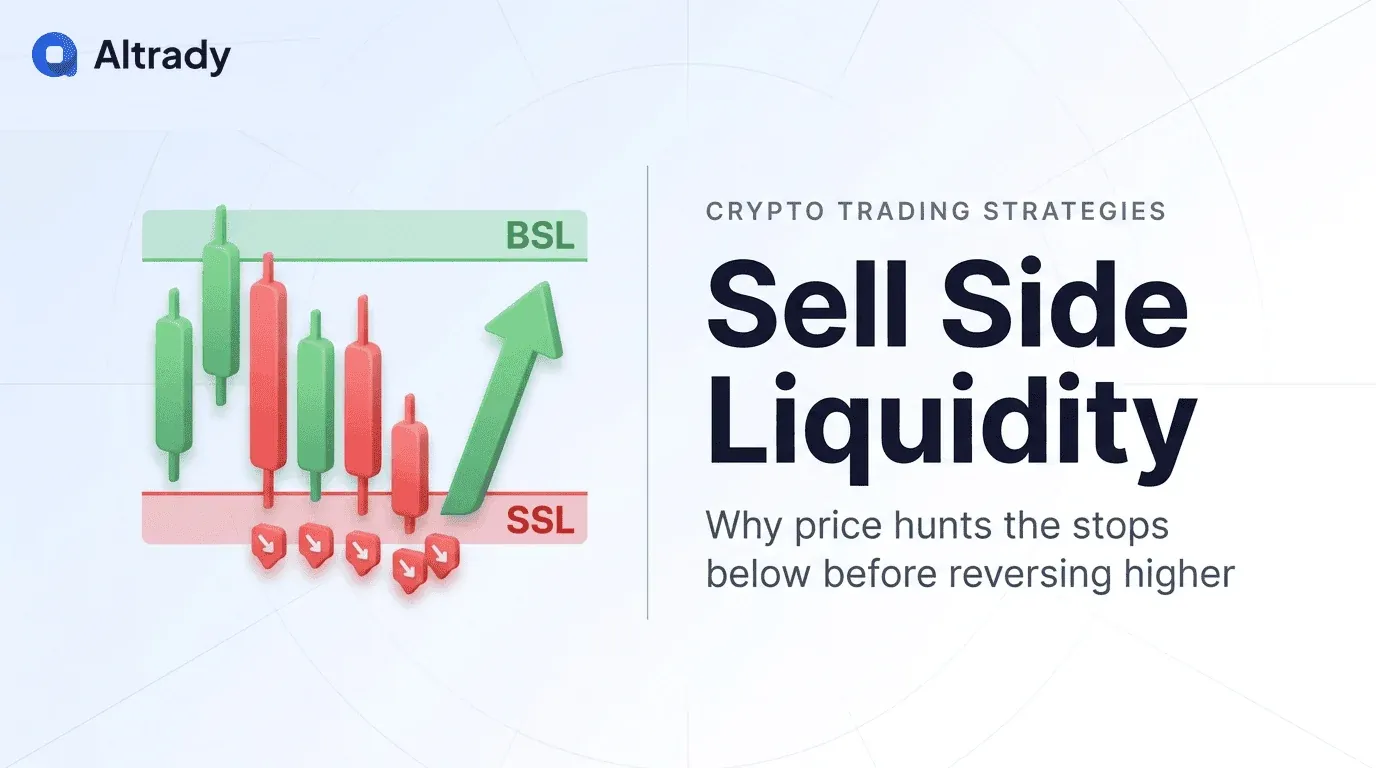

Sell side liquidity (SSL) is the pool of sell orders resting below the current price, mostly the stop-losses of traders who are long and the sell-stop orders of breakout traders, clustered just under swing lows, equal lows and support levels. When price trades down into that pool, those orders turn into market sells, which gives larger buyers the volume they need to fill their orders.
That is why price so often dips just below an obvious low, takes out the stops underneath, and then turns. This guide explains what sell side liquidity is, how it differs from buy side liquidity, where to find it on a chart, and what really happened after 13 sweeps of sell side liquidity on Bitcoin since June 2025.
- Sell side liquidity sits below price. It is made of long traders' stop-losses, breakout sell-stops and, on futures, the liquidation levels of leveraged longs.
- Buy side liquidity is the mirror image. It sits above swing highs and equal highs: short sellers' stops and breakout buy-stops.
- Look where stops are obvious. Swing lows, equal lows, range lows, trend line support, the previous day's or week's low and round numbers.
- A sweep is not a reversal by itself. Of 13 daily sweeps of a BTC swing low from June 2025 to October 2026, 9 made a new low within four days. Only 2 went on to take the buy side liquidity above.
- Trade the reaction, not the level. Wait for the sweep, a close back above the level and a shift in market structure, and keep the stop below the sweep low.
What Is Sell Side Liquidity?
Every trade needs two sides: for every buyer there has to be a seller at that price. Liquidity is simply the volume of orders available to trade against. Sell side liquidity is the part of that volume that sits below the market as sell orders waiting to be triggered.
Where the sell orders come from
- Stop-losses on long positions. A trader who buys above support usually places the stop just below it. When price reaches the stop, it executes as a market sell order.
- Breakout sell-stops. Traders who want to short a breakdown place sell-stop orders below support, so they enter as soon as the level breaks.
- Liquidations of leveraged longs. On crypto futures, a long position that hits its liquidation price is closed with a market sell by the exchange. Liquidation levels of popular leverage settings stack up below recent lows.
Why larger traders need it
A fund that wants to buy a large position cannot do it at the market price without pushing the price up against itself and getting a poor average entry. It needs a large volume of sellers at once. A dip into sell side liquidity provides exactly that: hundreds of stops and liquidations firing together create the selling that large buy orders can absorb. You do not need to believe in coordinated stop hunts for this to matter. Wherever many orders cluster, price tends to react.
Sell Side vs Buy Side Liquidity
Buy side liquidity (BSL) is the pool of buy orders resting above the current price, mostly short sellers' stop-losses and breakout buy-stops above swing highs and equal highs. Sell side liquidity is the same thing on the other side of the market.
| Sell side liquidity (SSL) | Buy side liquidity (BSL) | |
|---|---|---|
| Where | Below price: swing lows, equal lows, support | Above price: swing highs, equal highs, resistance |
| Made of | Long stop-losses, sell-stops, long liquidations | Short stop-losses, buy-stops, short liquidations |
| When triggered | Market sell orders | Market buy orders |
| Who uses it | Buyers who need sellers to fill large orders | Sellers who need buyers to exit or go short |
| Typical sign of a sweep | Wick below the low, close back above | Wick above the high, close back below |
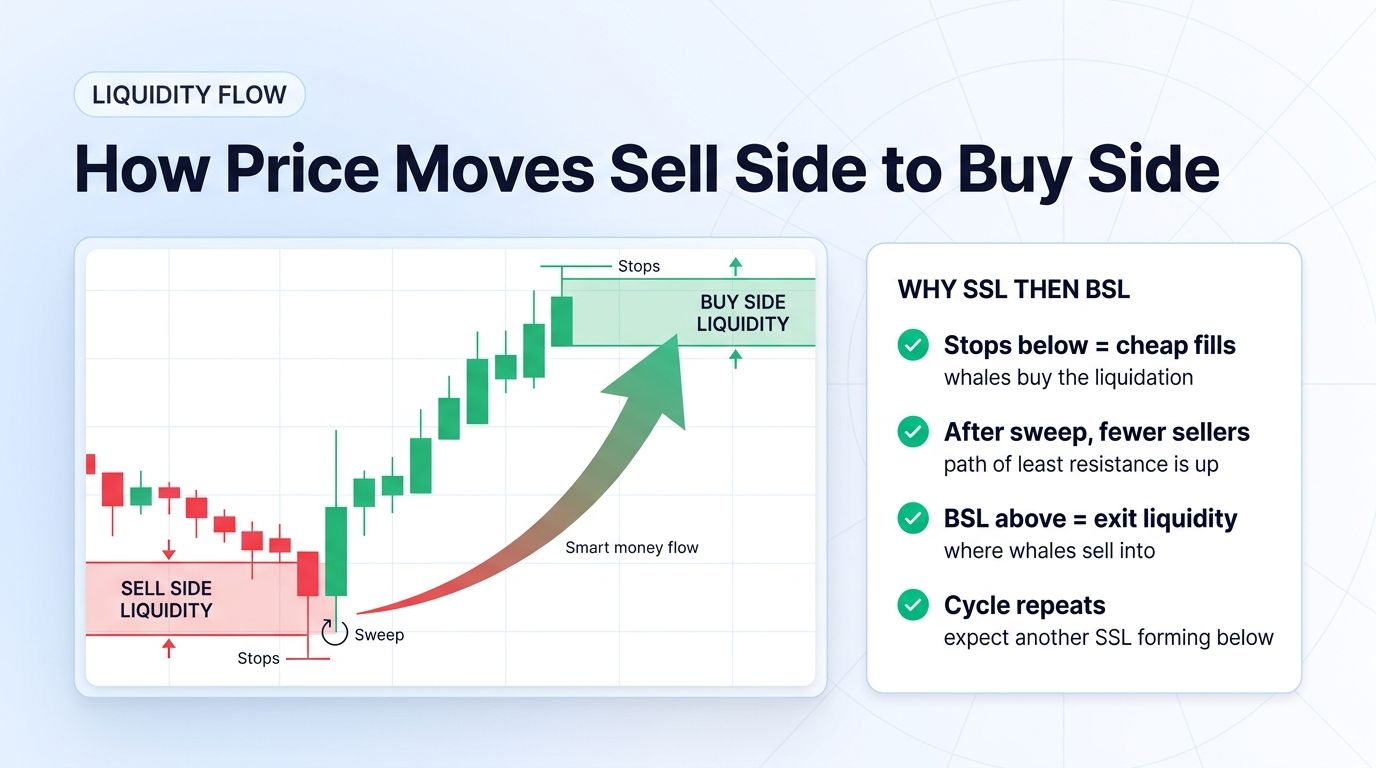
Price tends to travel between the two. After sell side liquidity below a range is taken, the next obvious target is often the buy side liquidity above it, and the other way round. That back-and-forth is how many smart money and ICT traders read a chart: they ask which pool of liquidity price is most likely to reach next.
How to Identify Sell Side Liquidity on a Chart
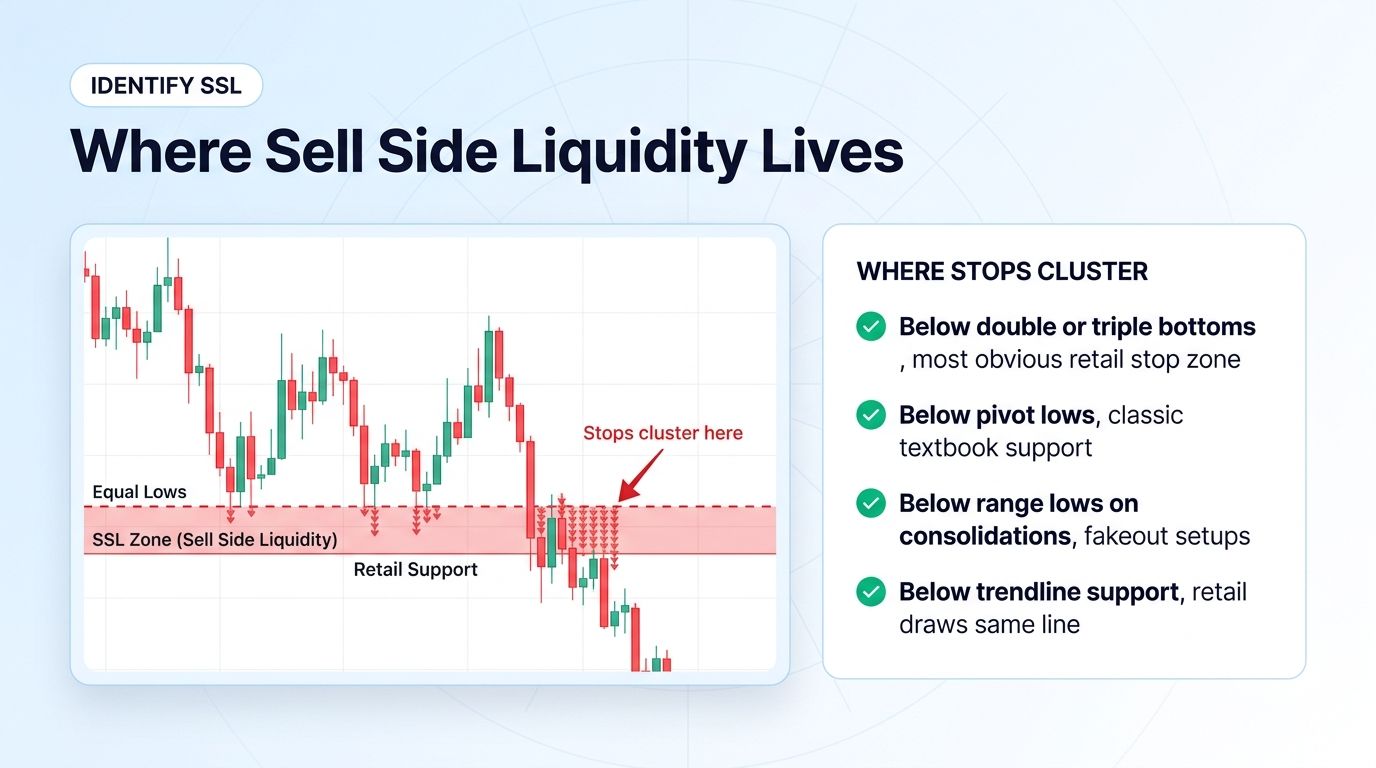
Liquidity gathers where most traders would put their stops, which means at the most obvious levels on the chart:
- Previous swing lows. Clear "V" bottoms that everyone can see. See how to identify swing highs and lows.
- Equal lows and double bottoms. Two or more lows at nearly the same price look like strong support, so stops stack below them twice over.
- Range lows. The bottom of a sideways range collects the stops of everyone who bought the range.
- Trend line support. Stops sit just under a rising trend line that many traders have drawn. See trendline trading.
- Session and period lows. The previous day's, week's or Asian session's low are widely watched reference points.
- Round numbers. Levels such as $80,000 on BTC attract stops and limit orders alike.
- Long liquidation clusters on futures. Estimated liquidation levels for 10x to 100x longs sit below recent lows. A liquidation map shows where they stack up.
The more obvious the level and the longer it has held, the more orders it usually has underneath. Higher timeframes matter more: a daily low is watched by far more traders than a 5-minute low.
Sell Side Liquidity Examples on BTC
The two examples below use Binance BTC/USDT daily candles. The first shows the textbook sequence; the second shows the far more common outcome in a falling market.
Example 1: Sell side swept, then buy side taken (October 2026)
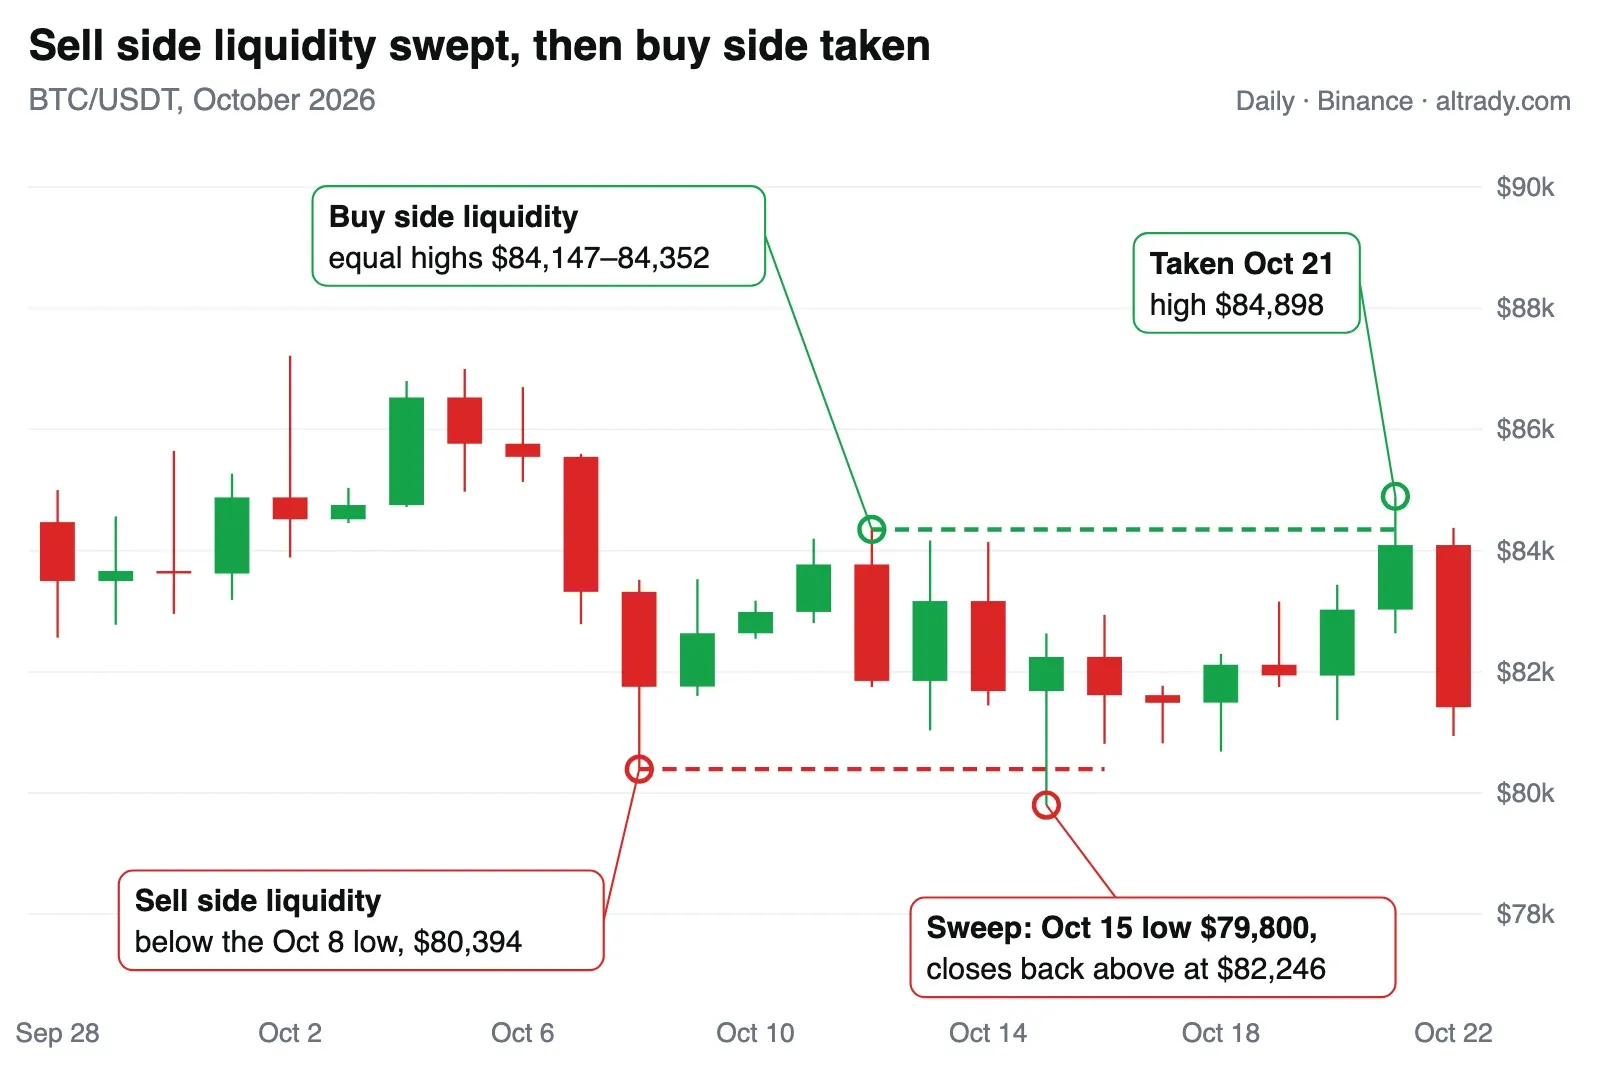
- The pools: sell side liquidity below the 8 October low at $80,394; buy side liquidity above the equal highs of 12 to 14 October at $84,147 to $84,352.
- The sweep: on 15 October BTC traded down to $79,800, through the stops below $80,394, and closed the day back above the level at $82,246.
- The other side: on 21 October price reached $84,898, taking the buy side liquidity above the equal highs. The next day it fell back to close at $81,416, so the range was still intact.
Example 2: A sweep that failed in a downtrend (January 2026)
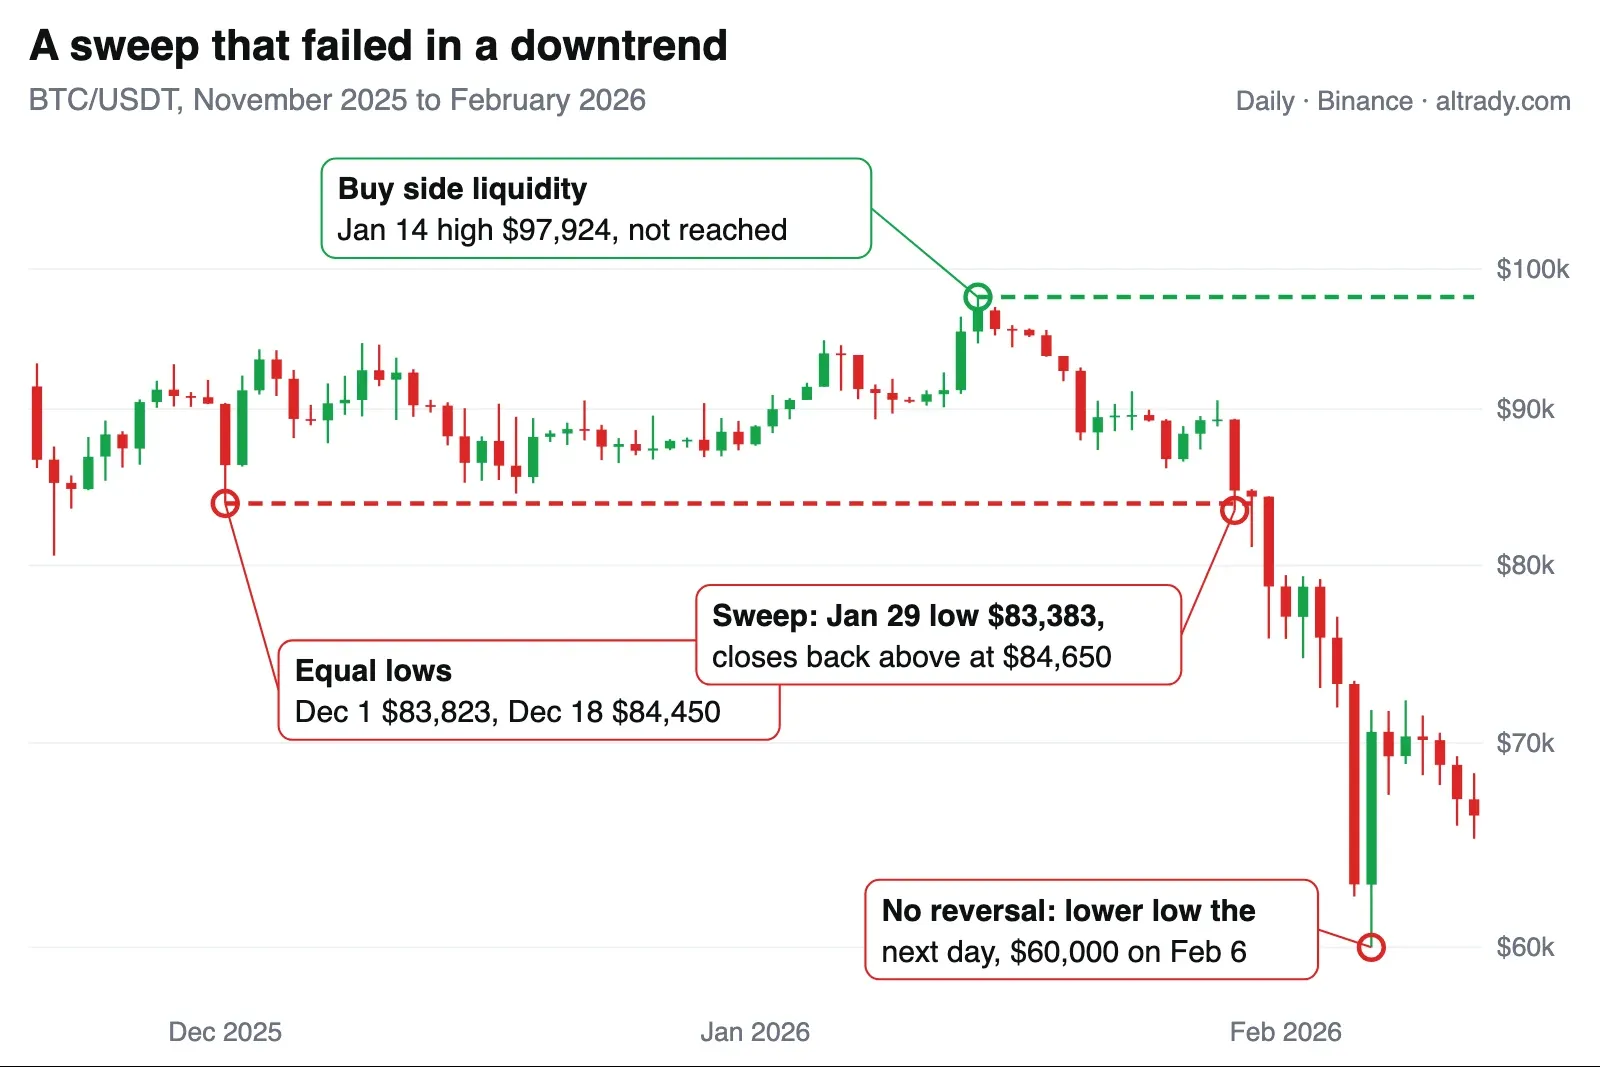
- The pool: equal lows on 1 December ($83,823) and 18 December ($84,450), a textbook double bottom with stops underneath.
- The sweep: on 29 January BTC dipped to $83,383 and closed back above the lows at $84,650, which looks exactly like Example 1.
- What happened next: the very next day price made a lower low at $81,118, and by 6 February BTC had fallen to $60,000. The buy side liquidity at the 14 January high of $97,924 was never reached.
The difference was context. In October 2026 BTC was ranging; in January 2026 it was in a downtrend, where the liquidity below is the target rather than the turning point.
How often did a sweep lead to a reversal?
We checked every case from 1 June 2025 to 22 October 2026 where a BTC daily candle traded at least 0.1% below a daily swing low, the first time price returned to it within 60 days, and closed back above it. A swing low is the lowest low of nine days, four on each side.
| Sweep date | Low swept | Sweep low / close | What happened next |
|---|---|---|---|
| 20 Jun 2025 | $102,664 (13 Jun) | $102,345 / $103,298 | New low 1 day later (21 Jun) |
| 22 Jun 2025 | $100,372 (5 Jun) | $98,200 / $100,964 | Reached the swing high at $110,530 on 9 Jul |
| 22 Aug 2025 | $111,920 (3 Aug) | $111,685 / $116,936 | New low 2 days later (24 Aug) |
| 10 Oct 2025 | $107,255 (1 Sep) | $102,000 / $112,774 | Held for 20 days, best rise 3.2%; swing high $126,200 not reached |
| 13 Nov 2025 | $98,944 (4 Nov) | $98,000 / $99,692 | New low 1 day later (14 Nov) |
| 14 Dec 2025 | $87,719 (7 Dec) | $87,577 / $88,172 | New low 1 day later (15 Dec) |
| 25 Jan 2026 | $86,420 (24 Dec) | $86,075 / $86,670 | New low 4 days later (29 Jan) |
| 29 Jan 2026 | $83,823 (1 Dec) | $83,383 / $84,650 | New low 1 day later (30 Jan) |
| 27 Mar 2026 | $65,618 (8 Mar) | $65,548 / $66,407 | New low 2 days later (29 Mar) |
| 23 May 2026 | $74,938 (29 Apr) | $74,290 / $76,752 | New low 4 days later (27 May) |
| 1 Jul 2026 | $58,115 (25 Jun) | $57,800 / $60,024 | Held for 20 days, best rise 11.5% |
| 11 Sep 2026 | $76,264 (2 Sep) | $76,047 / $77,226 | New low 4 days later (15 Sep) |
| 15 Oct 2026 | $80,394 (8 Oct) | $79,800 / $82,246 | Reached the swing high at $84,352 on 21 Oct (only 7 days of data so far) |
In 9 of the 13 cases BTC made a new low within four days, and only 2 reached the swing high above. Much of this period was a falling market, from $126,200 in October 2025 to $60,000 in February 2026, which is exactly the condition in which sweeps of sell side liquidity fail. The same check in a rising market would look different. The lesson is not that sweeps never work, but that a wick below a low is a starting point for analysis, not a signal on its own. Past price action does not guarantee future results.
How to Trade Around Sell Side Liquidity
- Start with the higher-timeframe trend. Buying a sweep works best in a range or an uptrend. In a downtrend, the liquidity below is more likely to be the destination.
- Mark the pool. Draw the swing low, equal lows or range low on the timeframe you trade, and note the buy side liquidity above as the possible target.
- Wait for the sweep and the close. Price should trade below the level and close back above it. A close below the level is a breakdown, not a sweep.
- Look for a shift in structure. On a lower timeframe, wait for price to break the last lower high after the sweep. See market structure in smart money trading.
- Put the stop below the sweep low. If price makes a new low after the sweep, the idea is wrong; Example 2 shows how far it can go when you hold on.
- Size from the stop. Decide the loss you accept and size the position from the distance to the stop. See how to calculate position size.
- Take profit into the buy side liquidity. The stops above the range are where the move often stalls.
Avoid putting your own stop exactly at the obvious level. Place it beyond the area where a sweep would reach, or wait to enter until the sweep has happened. For the mechanics of the sweep itself, see what a liquidity sweep is.
Spot and Trade Sell Side Liquidity With Altrady
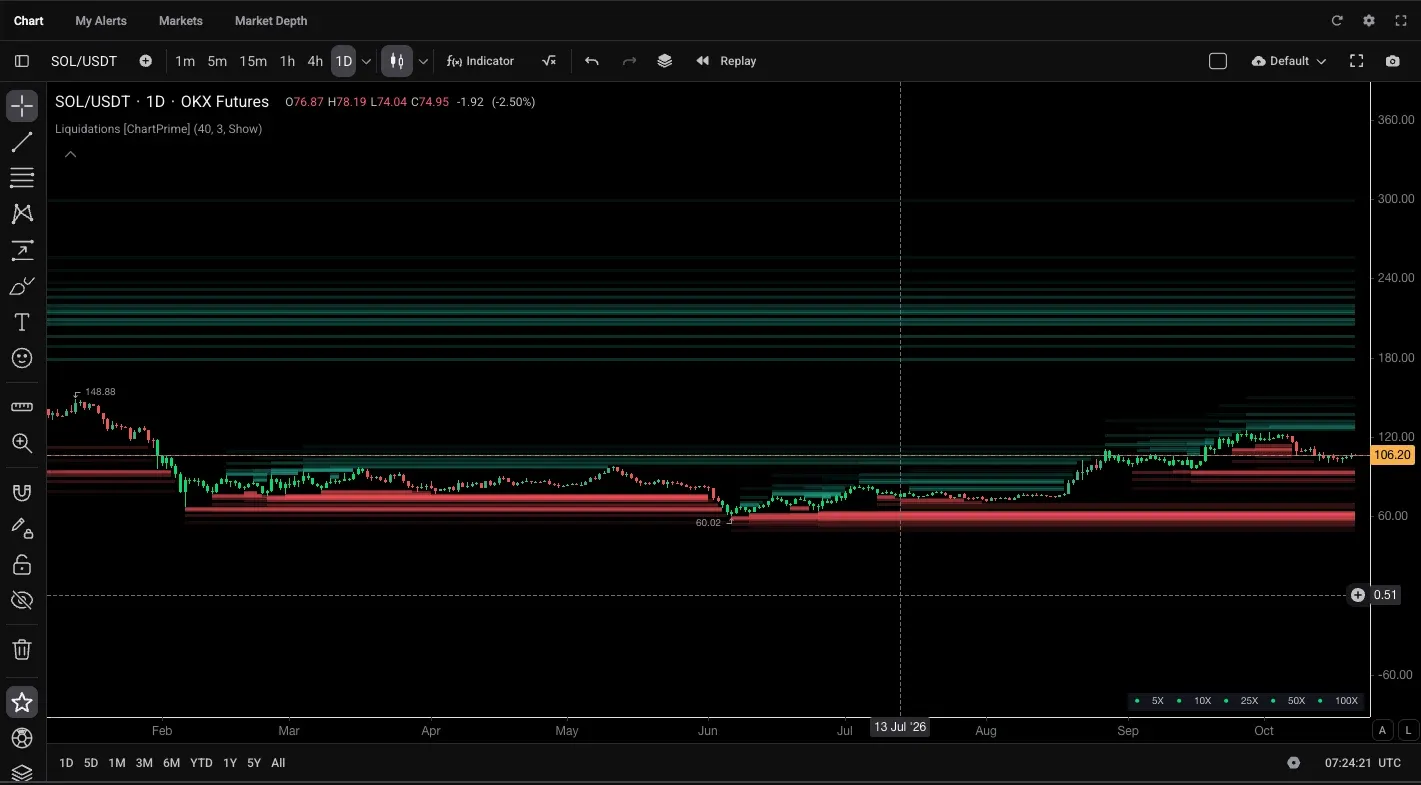
- See where long liquidations sit. Add the Liquidations [ChartPrime] indicator from the indicator search on an Altrady chart. It draws estimated liquidation levels for 5x to 100x leverage from recent pivots: red bands for longs below price, green bands for shorts above. They are estimates, not exchange data, but they show where forced selling would cluster.
- Get alerted at the level. Set a price alert just below the swing low or a trend line alert on support, so you see the sweep as it happens instead of watching the chart.
- Enter with the stop already placed. A smart order sets the entry, a stop below the sweep low and take profits at the buy side liquidity in one order, sized from the share of your account you choose to risk.
- Practise first. Replay past sweeps candle by candle with replay mode, or trade them on a paper trading account with simulated funds.
Frequently Asked Questions
What does sell side liquidity mean?
Sell side liquidity means the sell orders waiting below the current price: long traders' stop-losses, breakout sell-stops and, on futures, the liquidation levels of leveraged longs. It clusters under swing lows, equal lows and support.
What is the difference between buy side and sell side liquidity?
Sell side liquidity sits below price and turns into market sell orders when triggered. Buy side liquidity sits above swing highs and equal highs and turns into market buy orders. Price often moves from one pool to the other.
Is sell side liquidity bullish or bearish?
Neither on its own. Liquidity below price can pull price down toward it, and a sweep that closes back above the level can start a reversal. In a downtrend, though, sweeps often fail: in 9 of 13 BTC daily sweeps from June 2025 to October 2026, price made a new low within four days.
What is a sell side liquidity sweep?
A sweep is when price trades just below a level where sell side liquidity rests, triggers the stops, and then closes back above the level. A close below the level is a breakdown instead.
What is SSL in ICT trading?
In ICT and smart money trading, SSL is the abbreviation for sell side liquidity and BSL for buy side liquidity. Traders mark both and ask which pool price is likely to reach next.
How far below a swing low does liquidity rest?
There is no fixed distance. Most stops sit just below the low, while liquidation levels of leveraged longs can sit several percent lower depending on leverage. More volatile coins need a wider margin.
Do liquidity sweeps happen on all timeframes?
Yes, from 5-minute charts to weekly charts. Lows on higher timeframes are watched by more traders, so sweeps there usually involve more orders and lead to larger moves.
How can I avoid getting my stop-loss swept?
Do not place the stop exactly below an obvious low. Put it beyond the area a sweep would likely reach and size the position for that wider stop, or wait to enter until after the sweep has happened.
Mark the liquidity, get alerted at the level, and enter with the stop already below the sweep low. Start on a paper account.
No credit card required. Trading crypto involves risk; past performance does not guarantee future results.