
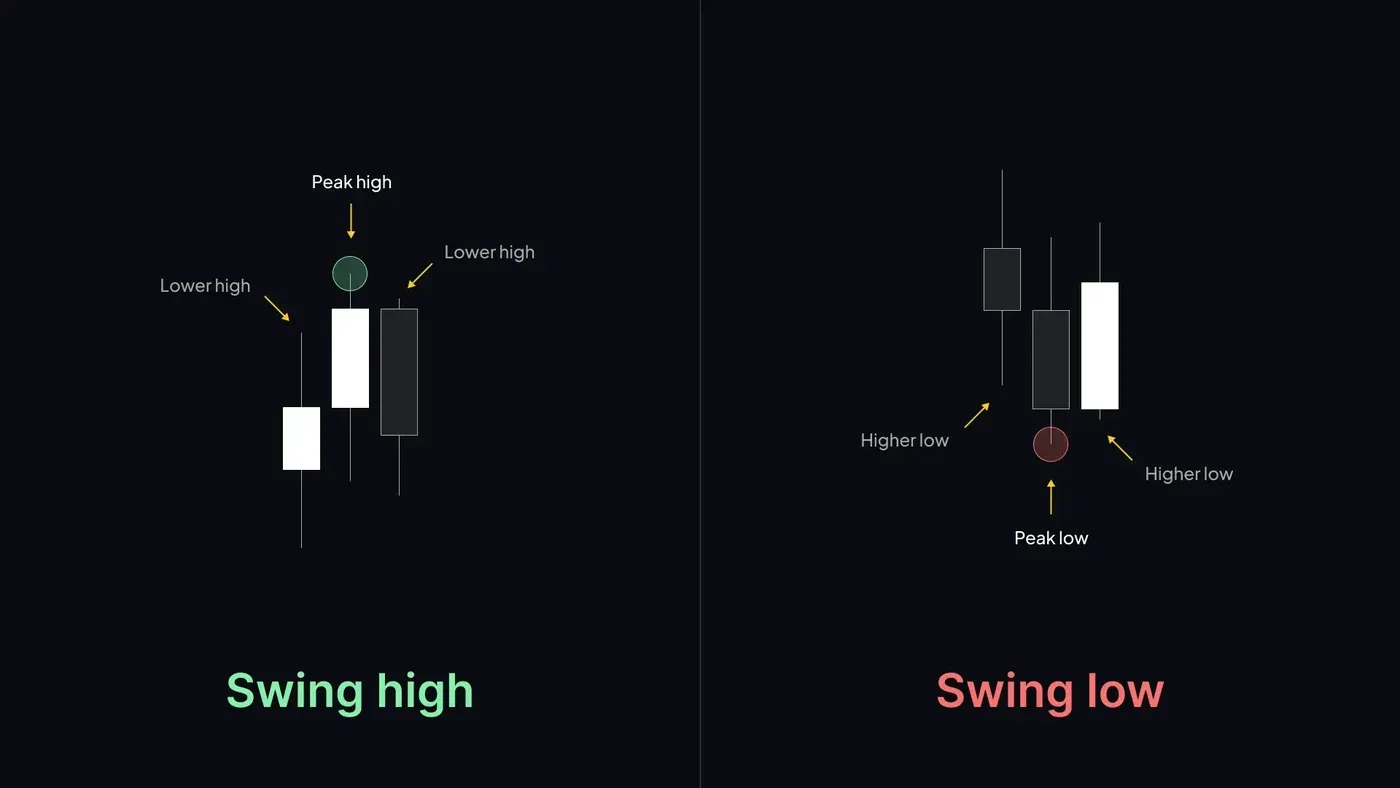
A swing high is a candle whose high sits above the highs of the candles on both sides; a swing low is a candle whose low sits below the lows on both sides. Traders compare one or two candles per side, then wait for a close that confirms the turn.
In Smart Money Concepts, swing points are the reference levels for trend and liquidity. This guide shows how to mark them the same way on every chart, so the rest of your analysis rests on levels you can trust.
What is a swing high and a swing low?
Swing high
A swing high is a turning point where rising price changes to falling price. On a candlestick chart it is the candle with the highest high in a small group: the candles immediately before and after it have lower highs. You will also see it called a pivot high.
Swing low
A swing low is the mirror image: a candle whose low is lower than the lows of the candles around it, marking where falling price turned up. It is also called a pivot low, and some traders say low swing.
Why a swing is only known after the fact
A candle cannot be called a swing high until the candles to its right have printed lower highs. On a finished chart every swing looks obvious, but in real time the most recent high is only a candidate. Every method for marking swings carries some lag, and the stricter the rule, the longer the wait.
How to identify a valid swing high and swing low
Six steps, applied the same way every time, turn swing marking from guesswork into a repeatable routine.
Step 1: Choose one timeframe
A clear swing on the 15-minute chart can disappear on the daily, so mark swings on one timeframe at a time. Mixing timeframes on one chart is the most common reason two traders disagree about the same swing.
Step 2: Find the candidate candle
Look for the candle with the highest high (or lowest low) in the local move. That candle is your candidate swing point.
Step 3: Apply the 3-candle or 5-candle rule
A neighbour rule decides whether the candidate qualifies:
- 3-candle rule: one lower high on each side of a swing high, or one higher low on each side of a swing low. It marks more swings and reacts faster, but picks up more noise.
- 5-candle rule: two lower highs (or higher lows) on each side. This is the definition behind the Williams Fractal indicator. It marks fewer, cleaner swings and confirms two candles later.
Neither rule is correct by default. What matters is using the same one throughout. Some beginners use a two-candle shortcut, a green candle followed by a red one, which marks almost every small pullback as a swing.
Step 4: Confirm with a candle close
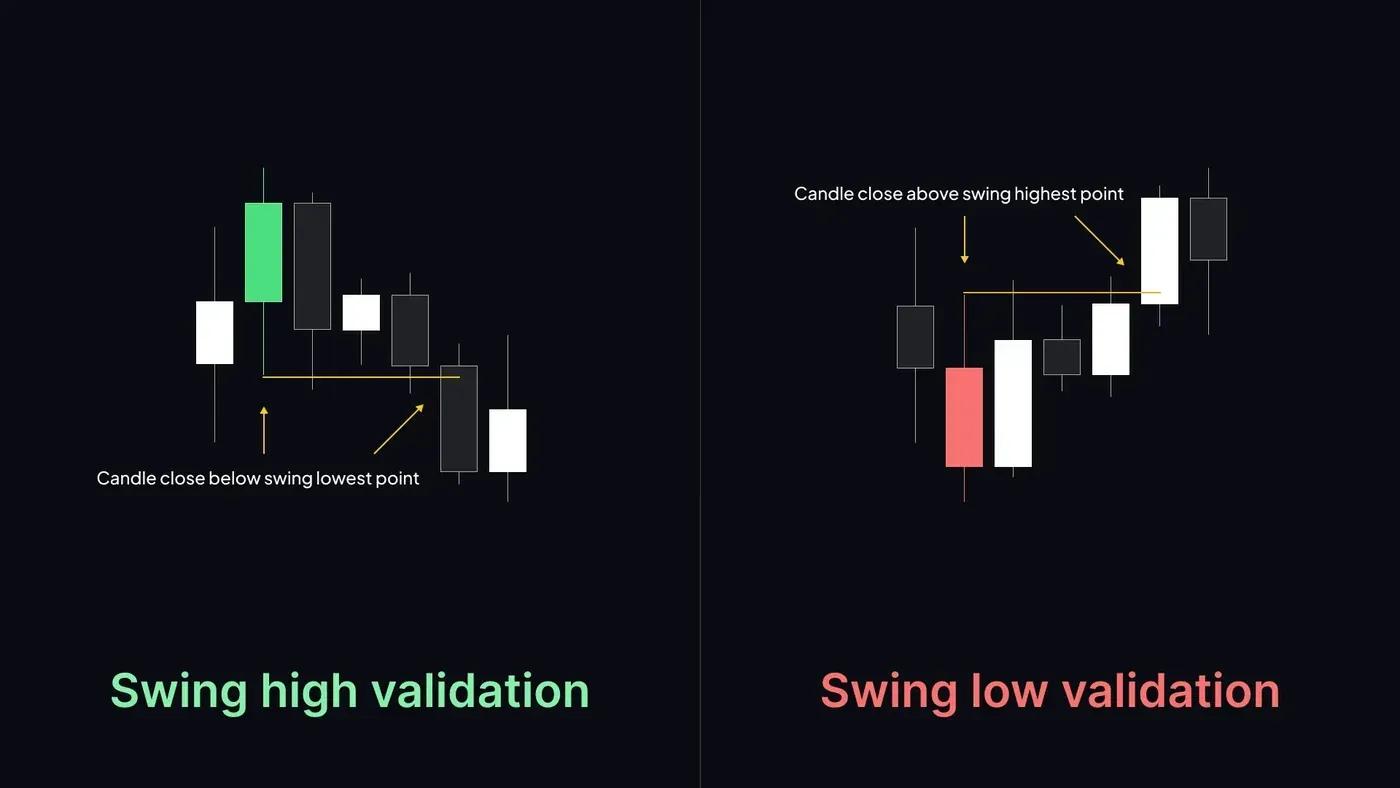
A common rule treats a swing high as confirmed once a later candle closes below the low of the swing-high candle, and a swing low once a later candle closes above the high of the swing-low candle. Before that close prints, the point is a candidate, not a valid swing.
Step 5: Wicks or bodies, pick one
Many traders mark the level at the wick, because that is where orders actually filled and where stops tend to cluster. Others use candle bodies to filter out one-off spikes. Either works if you apply it the same way on every chart. Mixing them creates two different levels for the same swing.
Step 6: Equal highs, inside bars and other edge cases
- Equal highs or lows: two candles with the same high form one equal-highs zone, not two separate swings.
- Inside bars: a candle that sits fully inside the previous candle's range does not create a new swing on its own.
- Doji: a doji can be the swing candle if its high or low meets the neighbour rule.
Marking swing points on crypto charts
Crypto spot markets trade 24/7, so most charts have no overnight or weekend gaps to work around, while CME bitcoin futures charts do gap over weekends. Thin weekend liquidity can print long wicks that create a swing on one exchange and not on another.
Because each exchange prints its own candles, the same swing low can sit at a slightly different price on different venues. In Altrady, Multi-Charts lets you open the same pair on several exchanges side by side, which shows whether a swing is broad or limited to one venue. Daily swings also depend on when the daily candle closes; most crypto exchanges close it at 00:00 UTC.
There are two ways to mark swings:
- By hand: you judge each pivot yourself, which takes practice but lets you ignore swings that do not matter.
- With an indicator: Altrady's charts include Williams Fractal and Zig Zag, which apply a swing rule mechanically but cannot tell a meaningful swing from a minor one.
Many traders use an indicator as a first pass and then remove the noise by hand.
Major and minor swing points
Minor, or internal, swings form inside a larger move; major, or external, swings are the extremes of that move. One common approach is to mark major swings on a higher timeframe such as the 4-hour or daily, and minor swings on the timeframe used to time entries.
In Smart Money Concepts, a new swing high usually only counts as structural once price has broken above the previous swing high. A later peak that stays below it is a swing on the chart, but not a structural one.
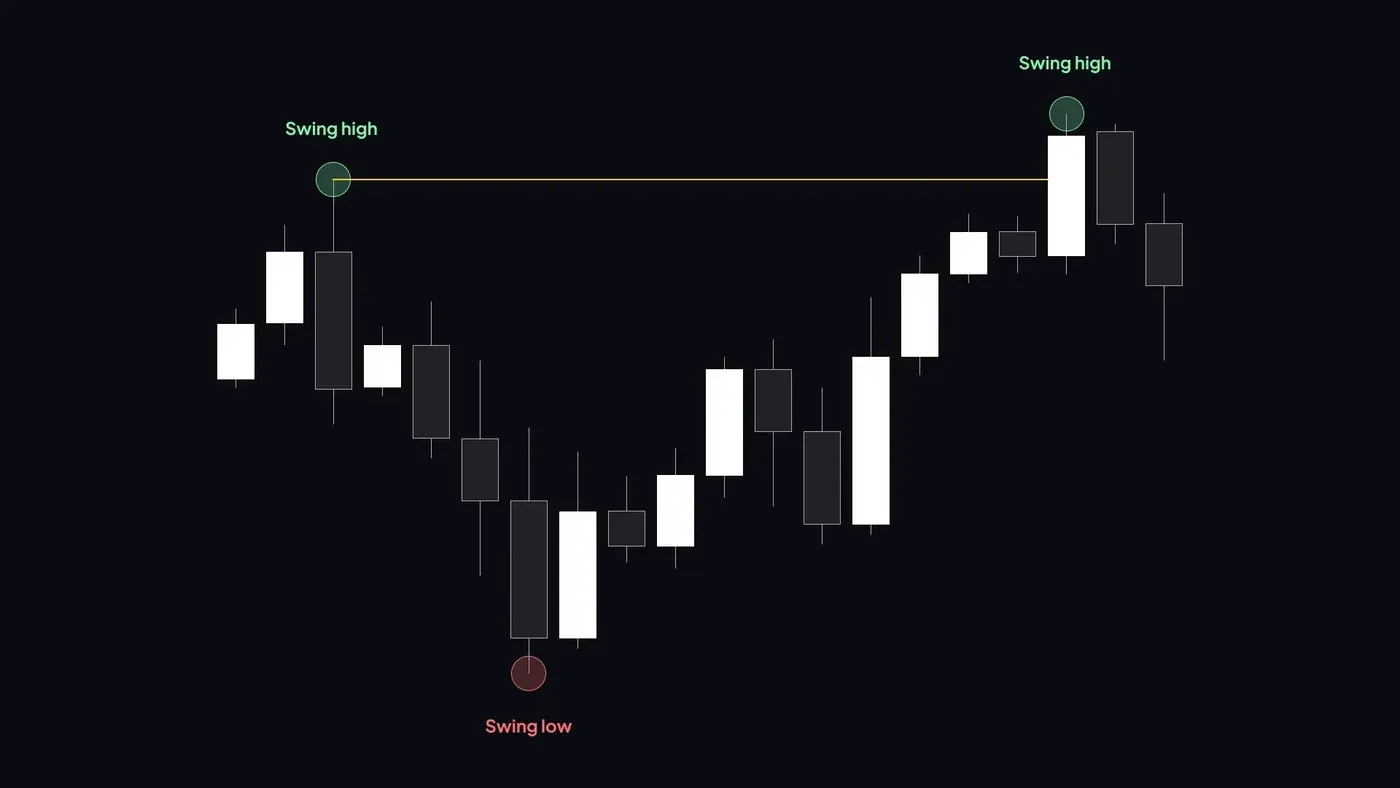
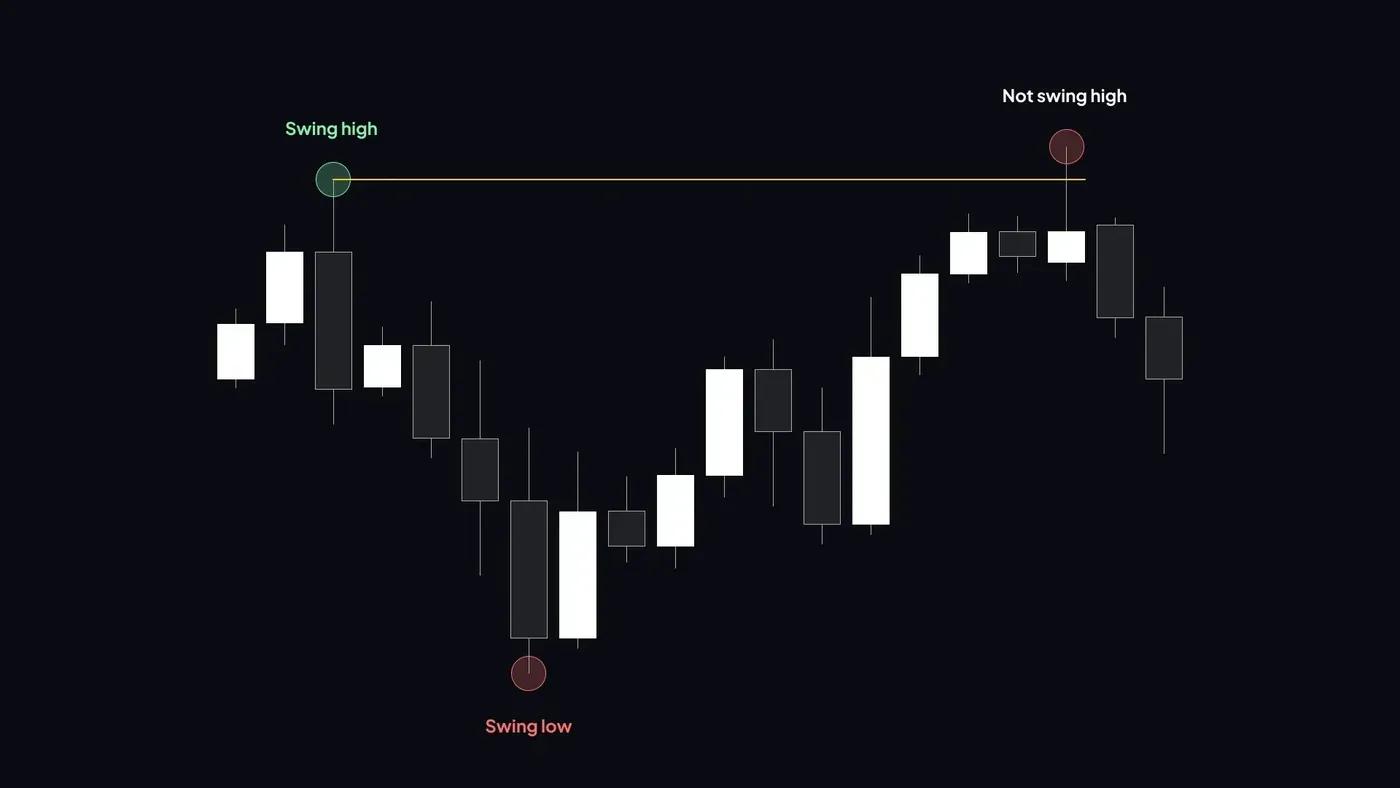
Which swing counts as structural is a market structure question, explained in detail in market structure in smart money trading.
Swing points and market structure (in brief)
Once swings are marked, their sequence describes the trend: higher highs and higher lows in an uptrend, lower highs and lower lows in a downtrend. When a candle body closes beyond a structural swing, SMC traders call it a Break of Structure.
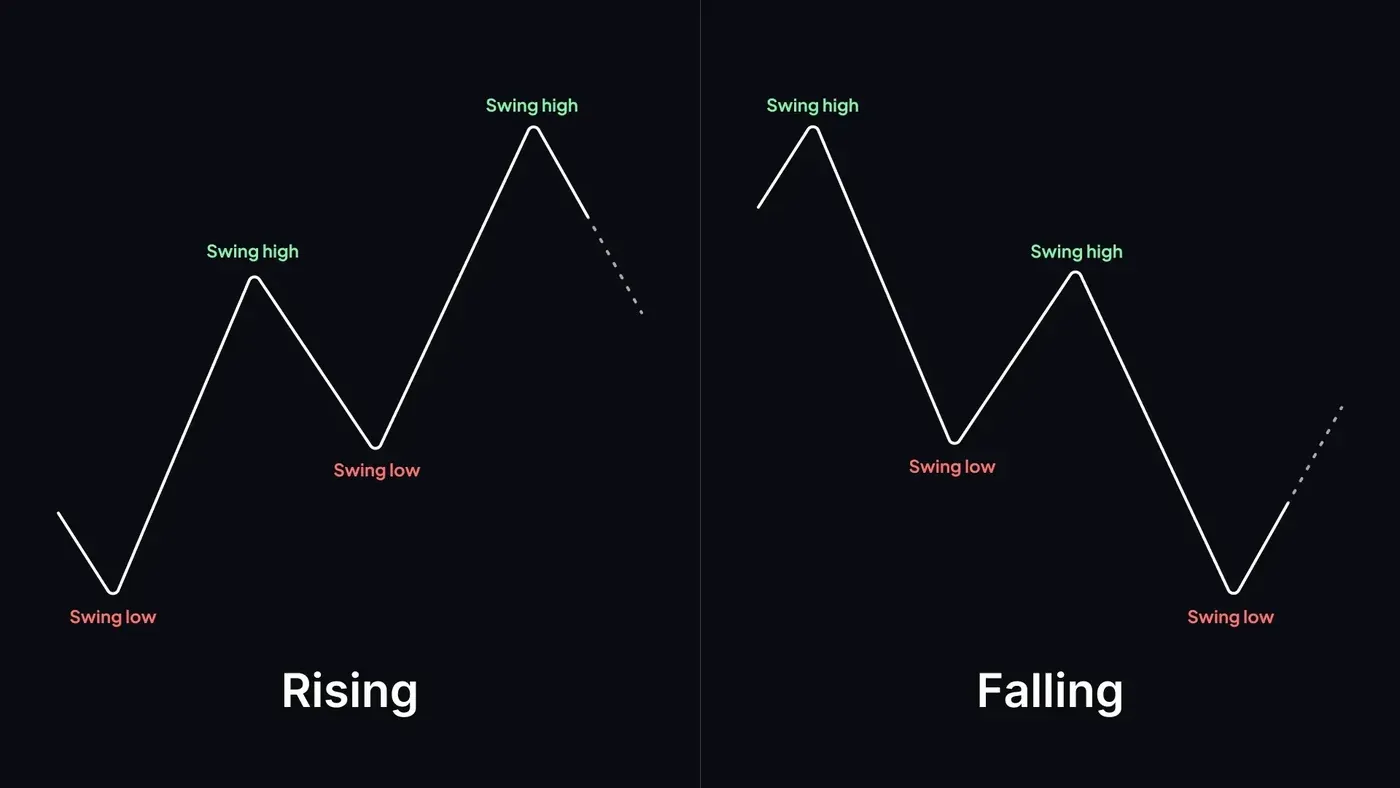
This page focuses on marking the swings themselves. For trend reading, structure shifts and how a Break of Structure is confirmed, see the market structure guide.
Liquidity around swing highs and lows
Buy-side and sell-side liquidity
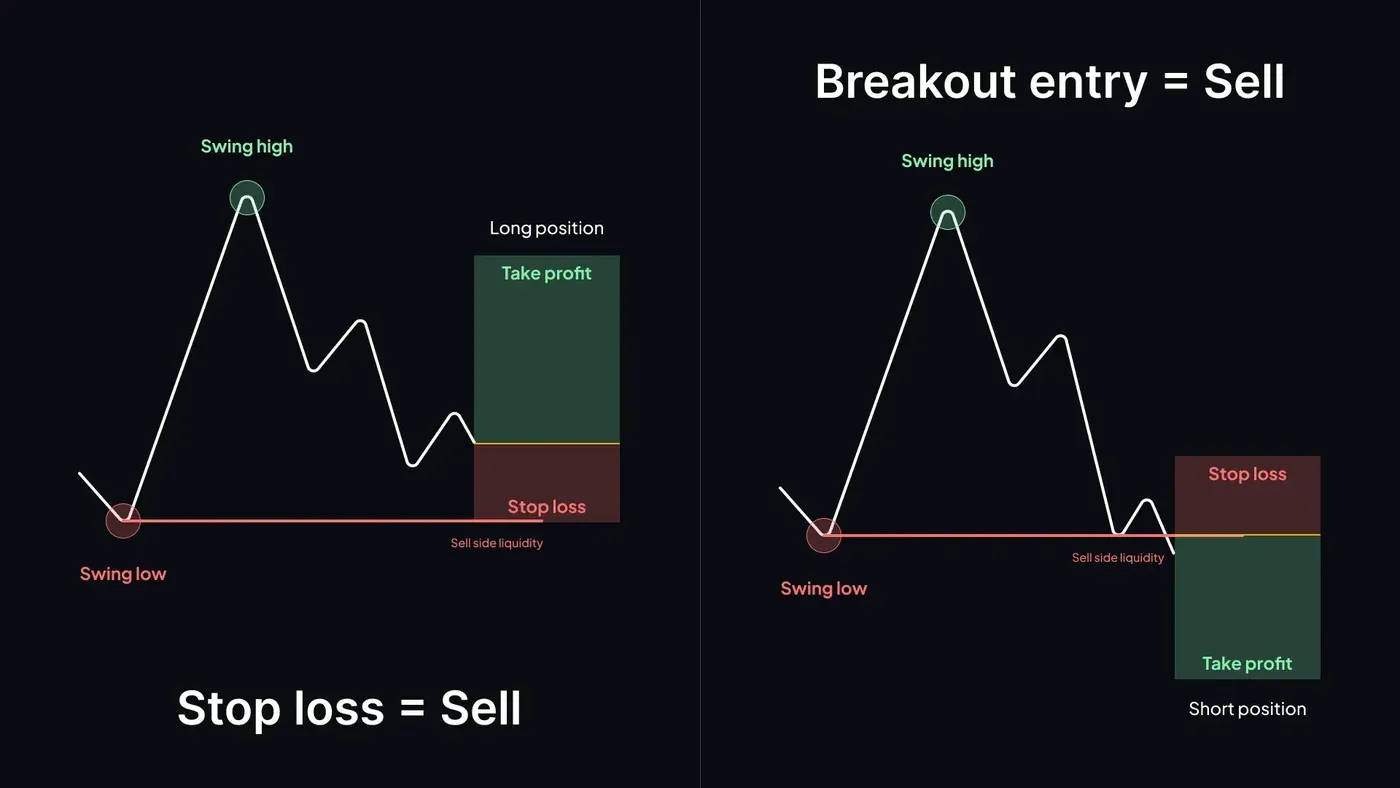
Because many traders put stop-loss orders just beyond swing points, those areas hold resting orders:
- Buy-side liquidity sits above swing highs: the stops of short positions, which become buy orders when triggered.
- Sell-side liquidity sits below swing lows: the stops of long positions, which become sell orders when triggered. More on this in what is sell-side liquidity.
Sweep or close: reading what happened at the level
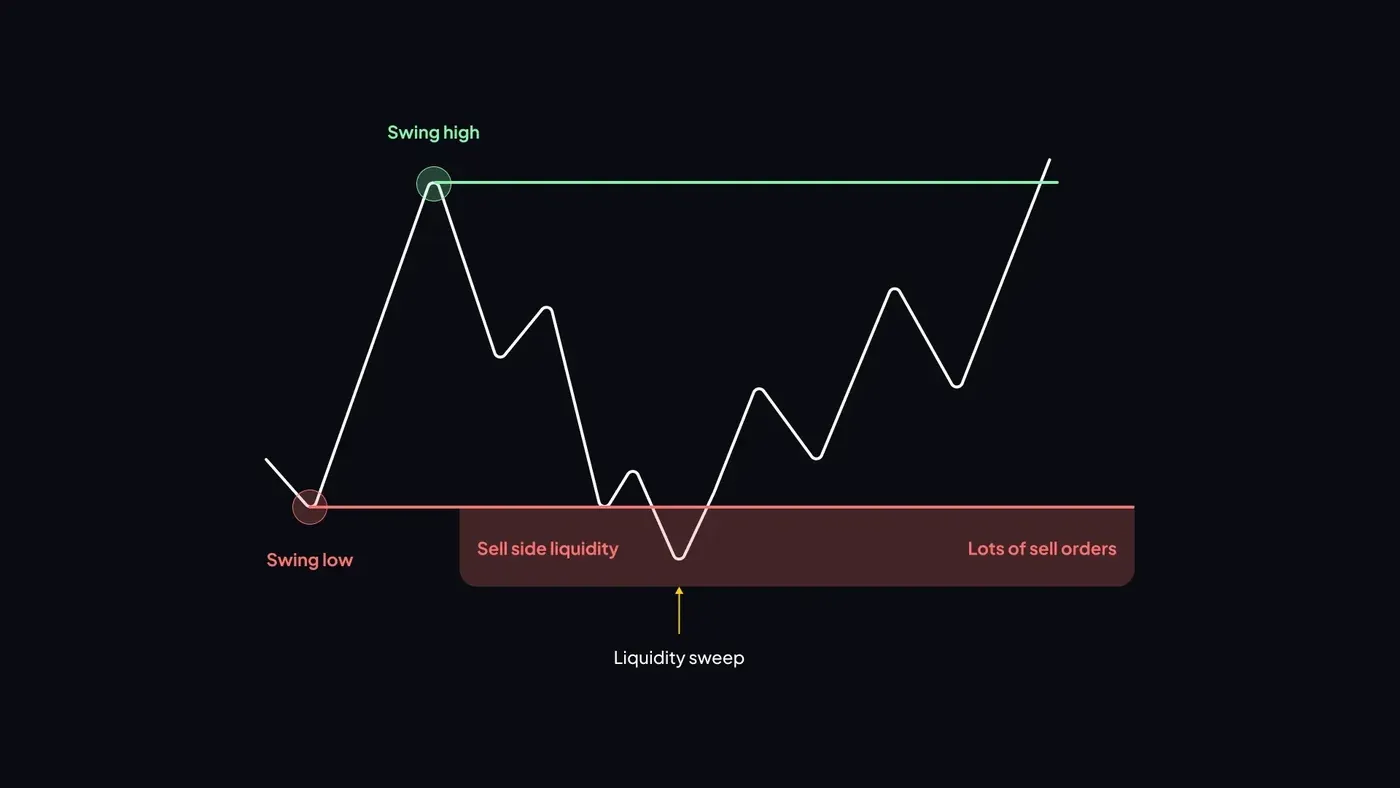
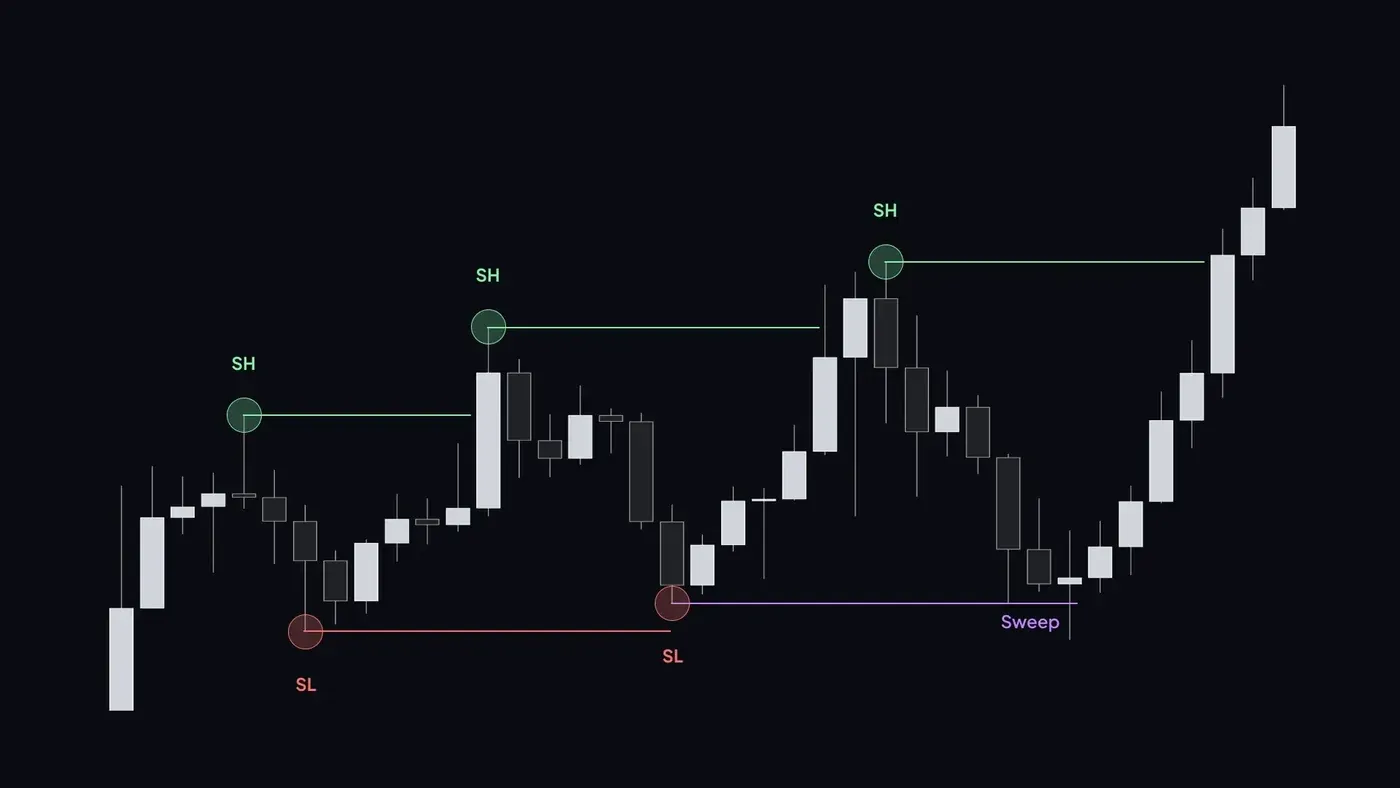
When price wicks through a swing level and closes back inside, it is read as a sweep: the stops were triggered, but price did not hold beyond the level. A candle body that closes beyond the level is read differently, as acceptance of the new price area. Large participants and algorithms can make moves around these levels fast and volatile, so the close matters more than the wick.
Find more details about price reversals in this webinar:
Common mistakes when marking swing highs and lows
- Marking every small move as a swing, which turns the chart into noise.
- Using the two-candle shortcut, which has the same effect.
- Mixing timeframes on one chart, so a 5-minute swing gets treated like a daily one.
- Treating a wick through a level as a break.
- Hindsight bias: on a finished chart every swing looks obvious, but in real time it is only a candidate until confirmed.
- Redrawing levels after the fact to fit a trade idea.
- Switching between wicks and bodies from one swing to the next.
How traders use swing points, and the risks
Common uses are reading trend direction, a reference for stop-loss placement, alert levels and possible target zones.
Stop placement has more than one option, each with a risk. A stop just beyond the swing wick keeps the potential loss small, but it sits where stops cluster, so it is exposed to sweeps. A stop beyond a buffer or zone, for example one sized with a volatility measure, is less exposed to sweeps but means a larger loss if hit.
In Altrady, a price alert at a marked swing level notifies you when price reaches it, and Smart Trading can attach a stop loss and take profit targets to a position at levels you define. None of this makes a level hold: swing points describe where price turned before, not where it will turn next.
Practice on historical charts
A simple routine:
- Pick one pair and one timeframe.
- Mark every swing with one rule, 3-candle or 5-candle.
- Note which swings were confirmed by a close.
- For each later test of a level, record whether it was a sweep or a close beyond.
- Repeat on a second timeframe.
Paper trading in Altrady lets you run the same routine in real time without real funds at stake.
Final thoughts
Swing highs and lows are simple to define and easy to mark inconsistently. A fixed neighbour rule, a confirmation close and one choice between wicks and bodies make your marks repeatable, which is what the rest of Smart Money analysis depends on.
To practise the routine on live charts, start a free trial on Altrady: you get 5 days free with no credit card, and if you do not upgrade after that, your account moves to Altrady's free paper trading plan so you can keep practising.
FAQ
What is a quick checklist for identifying swing highs and lows?
Pick one timeframe. Find the highest high or lowest low in the local move. Check that the neighbouring candles have lower highs (for a swing high) or higher lows (for a swing low), using one or two candles per side. Wait for a later candle to close beyond the pivot candle's opposite extreme to confirm it. Mark the level at the wick or the body, and keep that choice on every chart.
What is a low swing?
A low swing, more often called a swing low or pivot low, is a point where falling price turns and starts rising. On a candlestick chart it is the candle whose low is lower than the lows of the candles immediately before and after it. It only becomes visible once the candles to its right have printed higher lows.
What are swing lows in trading?
Swing lows are recent turning points that traders use as reference levels. A series of higher swing lows is commonly read as an uptrend. Many traders place stop-loss orders just below swing lows, so in Smart Money Concepts the area below a swing low is called sell-side liquidity. Some traders also treat swing lows as possible support. None of these readings guarantees how price will behave the next time it reaches the level.
How do you validate a swing high or swing low?
First check the shape: a swing high needs lower highs on both sides, and a swing low needs higher lows on both sides, using one candle per side (3-candle rule) or two (5-candle rule). Then wait for confirmation: a later candle closes below the low of the swing-high candle, or above the high of the swing-low candle. Until that close prints, the point is a candidate, not a valid swing. Whether a swing is also structural, meaning it matters for trend, is covered in the market structure guide.
Does a wick through a swing high count as a break?
In Smart Money Concepts, usually not. A wick that pierces a swing high and closes back below it is read as a liquidity sweep: stops above the high were triggered, but price did not hold there. A candle body closing above the swing high is treated differently, and is what traders check before calling a Break of Structure.