
Trendline trading means using a line drawn across a market's swing lows or swing highs to decide where to enter, where to place the stop, and when the trend has ended. In a rising market you buy pullbacks to the line; in a falling one you sell rallies into it; and a decisive close through the line tells you that trend is over.
This chapter is the practical side of trend lines: how to draw one that holds, the two setups traders use most, where stops and targets go, and two real BTC/USDT examples, one that worked and one that failed. For the definition and the types of trend line, start with what trend lines are. It is educational and not financial advice.
Key Takeaways
- Two points draw a line, the third confirms it. Connect two swing lows (uptrend) or two swing highs (downtrend), then wait for price to come back and respect the line before you trust it.
- Treat the line as a zone. Crypto wicks through lines all the time. Judge touches and breaks on candle closes, not single wicks.
- Two setups cover most trades. The bounce trades with the trend at the line; the break-and-retest trades the change after the line fails.
- The line gives you the stop. Place it beyond the line and the last swing point, then size the position from that distance.
- A break ends the line, not always the trend. BTC broke its falling trend line in January 2026, rallied 9%, then fell to $60,000. Confirm with structure and keep the stop.
What Is Trendline Trading?
A trend line is a straight line that connects at least two swing lows in an uptrend or two swing highs in a downtrend. Trendline trading uses that line as a moving support or resistance level: the place where a pullback is likely to stop, and the place where a trend is proven wrong if price closes through it.
A horizontal support and resistance level stays at one price. A trend line rises or falls with the trend, so the level you trade against changes every day. That is what makes it useful in trending crypto markets, and also why it needs redrawing less often than traders think: if you have to keep moving the line to fit the candles, the line is not valid.
How to Draw Trend Lines Correctly
- Find the trend first. An uptrend makes higher highs and higher lows; a downtrend makes lower highs and lower lows. See how to identify swing highs and lows.
- Connect two clear swing points. Uptrend: the two most obvious swing lows. Downtrend: the two most obvious swing highs. Pick turning points other traders can see, not minor wiggles.
- Extend the line to the right. That is where it becomes useful: it shows where the next pullback may stop.
- Wait for a third touch. Two points will always make a line. A third reaction at the line is what shows the market respects it.
- Do not cut through candle bodies. Wicks may poke through; bodies closing beyond the line between your two anchor points mean the line is drawn wrong.
- Use a log scale on long crypto charts. Over months, a coin can double or halve. On a linear chart a trend line drawn across that range bends the wrong way; a log scale keeps percentage moves equal, so the line stays true.
- Check the angle. Very steep lines break quickly and say little about the trend. Lines that hold for weeks at a moderate slope matter more.
Valid vs weak trend lines
| Check | Stronger line | Weaker line |
|---|---|---|
| Touches | 3 or more clear reactions | Only the 2 anchor points |
| Time span | Weeks to months on the daily chart | A few candles on a low timeframe |
| Angle | Moderate slope that price can follow | Near-vertical, after a spike |
| Spacing | Touches spread out over time | Touches bunched together |
| Candle bodies | No closes beyond the line between anchors | Line drawn through bodies to make it fit |
For more validation checks, such as lining up timeframes and reading volume at the line, see interpreting trend lines.
Trendline Trading Strategies
Strategy 1: The trend line bounce
This setup trades with the trend. In an uptrend you wait for price to pull back to a rising trend line that already has two clear touches, then look for a sign that buyers are defending it.
- Entry: a bullish reaction at the line, such as a candle that wicks below and closes back above it, or a lower-timeframe higher low.
- Stop: below the line and below the pullback low, so a small wick through the line does not take you out.
- Target: the previous swing high first; trail the stop under the line if the trend continues.
- In a downtrend: mirror it. Sell rallies into a falling trend line, with the stop above the line and the last swing high.
Strategy 2: The break and retest
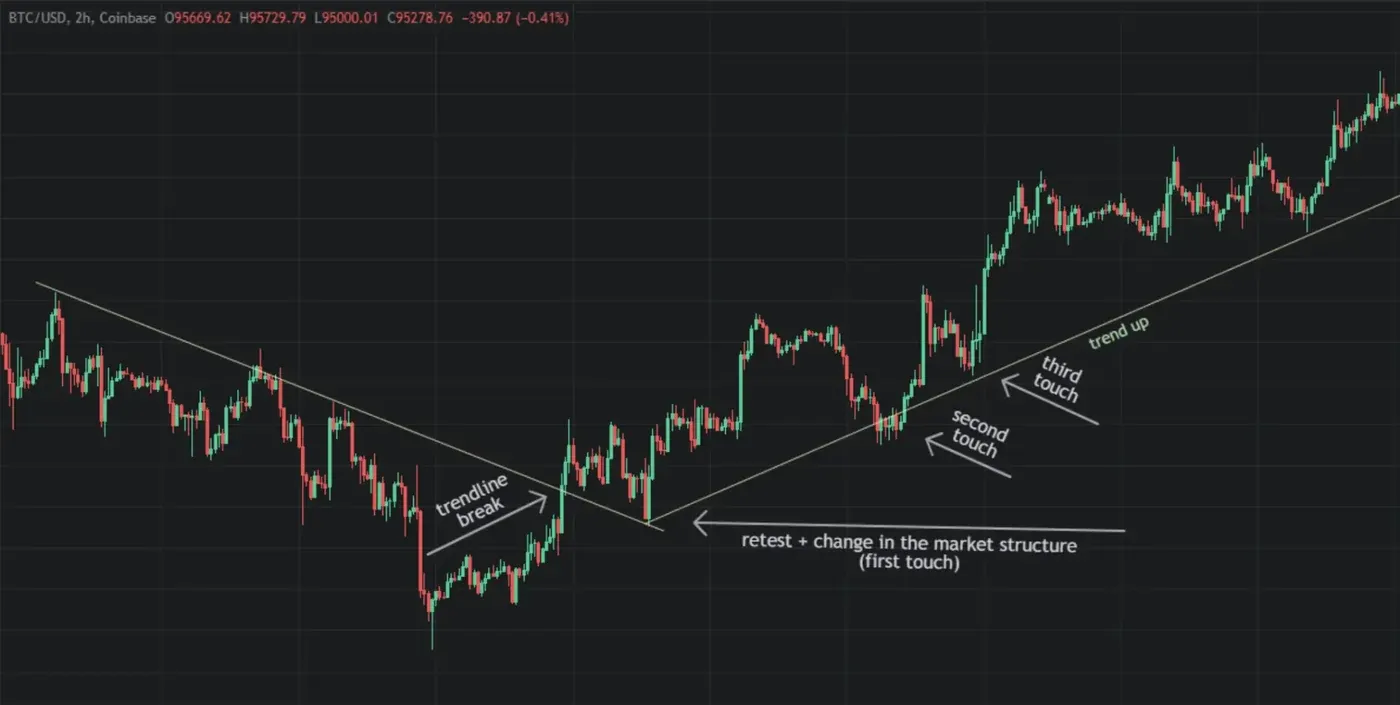
This setup trades the change. When price closes decisively through a trend line, the line often flips: old support becomes resistance, or old resistance becomes support. Many traders wait for price to come back to the broken line and hold it before entering.
- Break: a candle close clearly beyond the line, ideally on rising volume. One wick through the line is not a break.
- Retest: price returns to the broken line and fails to get back through it.
- Entry: on the rejection from the retest, in the direction of the break.
- Stop: back on the other side of the line, beyond the retest's swing point.
- Confirmation: a change in market structure, such as the first higher low after a downtrend, makes the setup stronger.
Strategy 3: Trend line plus confluence
A trend line is stronger when something else agrees with it. Look for the line crossing a horizontal level, a moving average, or a Fibonacci retracement in the same zone, or for an oscillator such as the RSI turning up from oversold as price reaches a rising line. Volume helps on both setups: a bounce on falling selling volume and a break on rising volume both carry more weight. See volume analysis.
Two Real Trend Lines on BTC/USDT
These two examples use Binance BTC/USDT daily candles on a log scale. They show what each setup looked like in hindsight, so read them as illustrations, not a backtest: past price action does not guarantee future results.
Example 1: A rising trend line that held, then broke (2025)
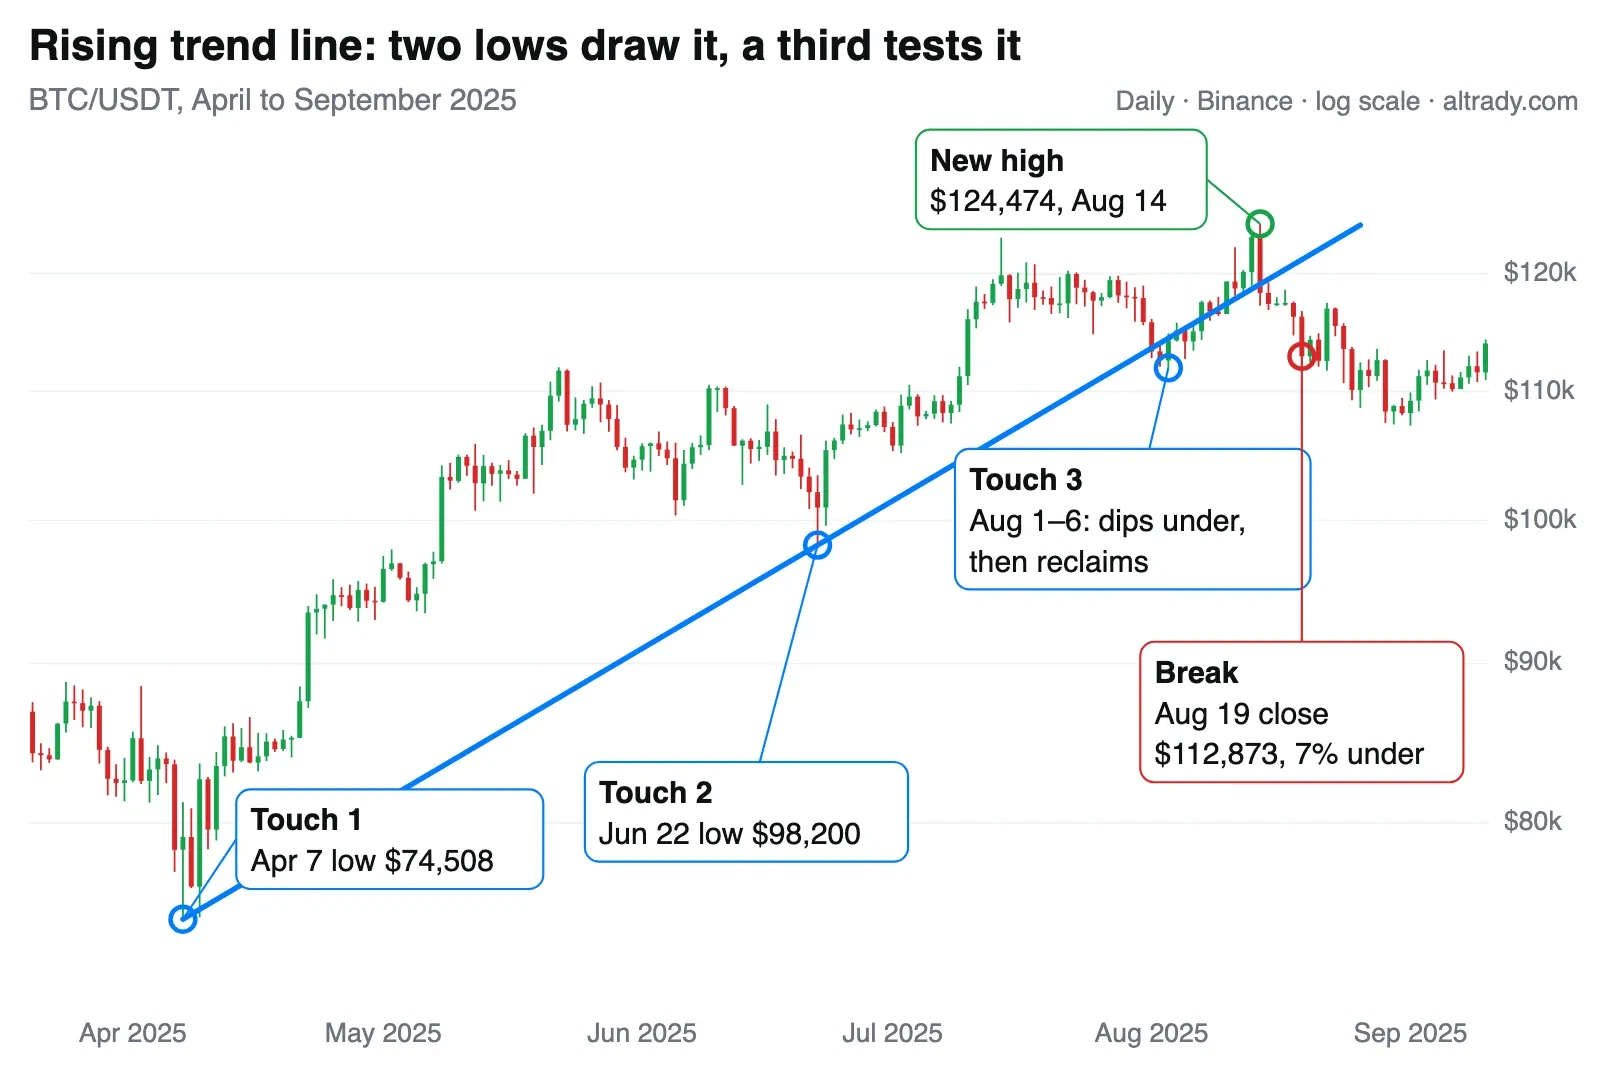
- Drawing it: the line connects the 7 April low ($74,508) and the 22 June low ($98,200), rising about 0.36% a day.
- The third touch: in early August, BTC dipped just under the line for a few days, with a low of $111,920 on 3 August, then closed back above it. That is the line acting as a zone, not an exact price.
- The bounce: from the 3 August close at $114,209, price ran to a new high of $124,474 on 14 August, about 9%.
- The break: price closed under the line from 14 August, and by 19 August the close of $112,873 was about 7% below it. The line no longer held, and BTC fell to $107,255 on 1 September.
A trader using Strategy 1 had a clear plan: buy the reclaim of the line, stop under the $111,920 low, and exit once candles closed under the line instead of bouncing from it.
Example 2: A falling trend line broke, and the trend did not turn (2025–2026)
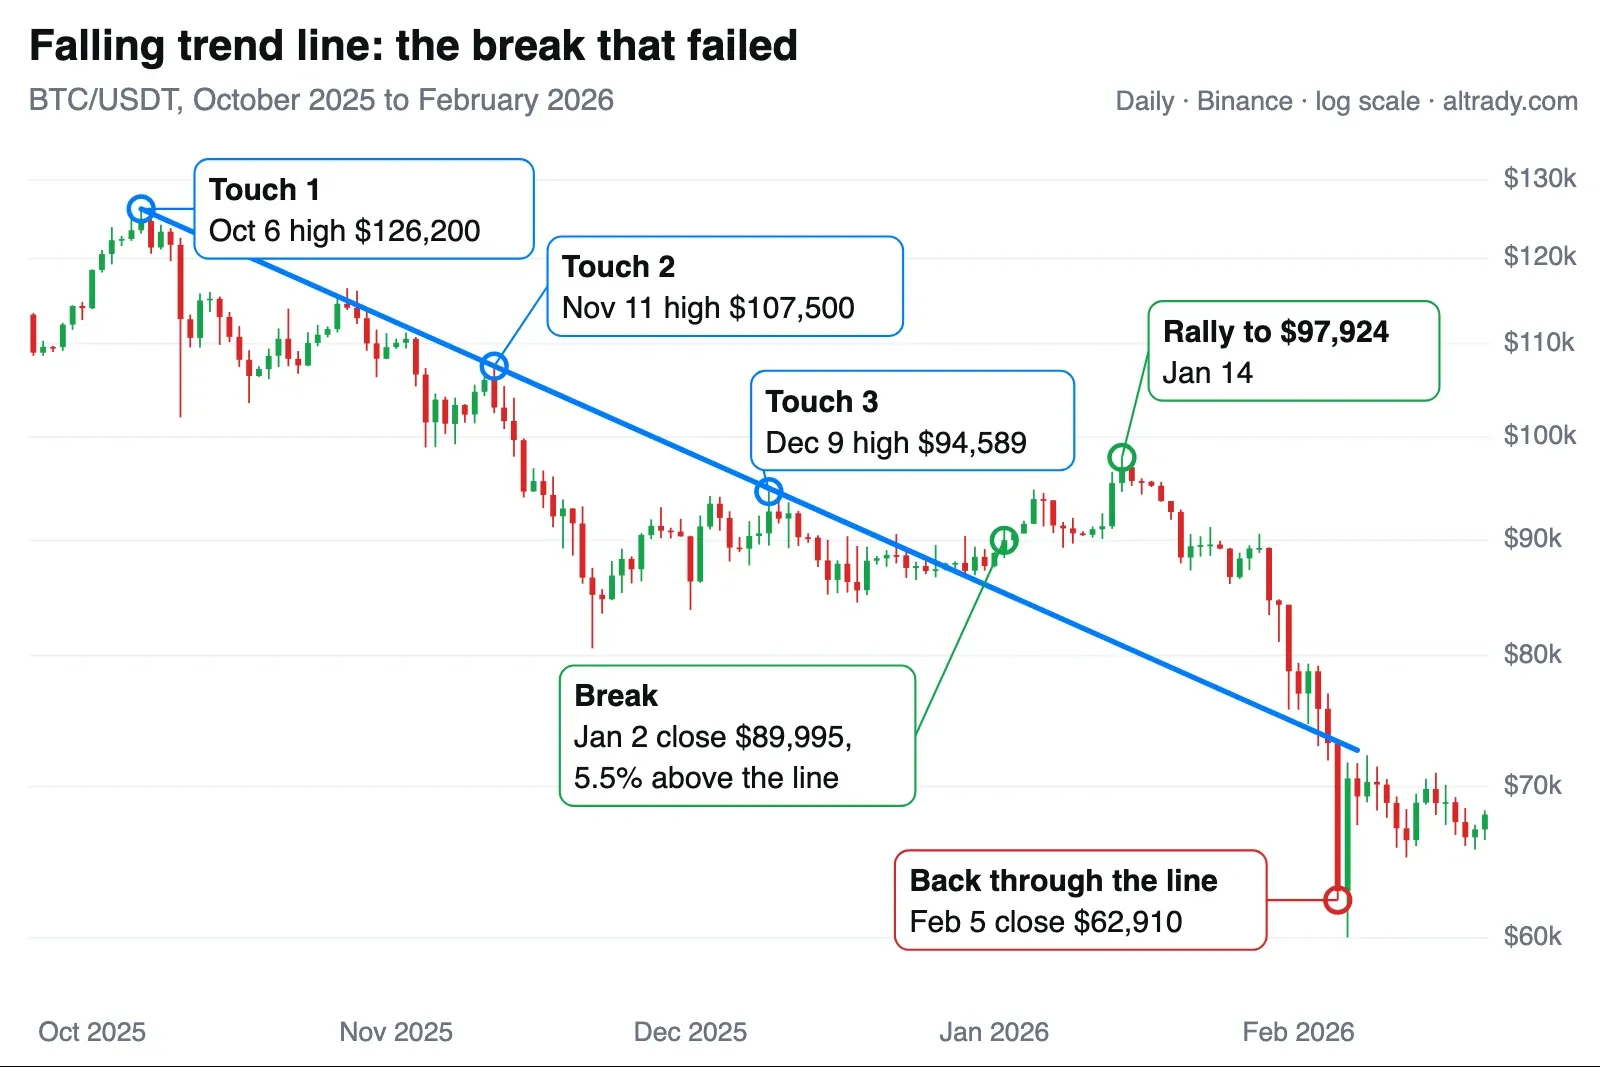
- Drawing it: the line connects the 6 October high ($126,200) and the 11 November high ($107,500).
- The third touch: on 9 December, BTC reached $94,589, right at the line, and turned lower. The line was confirmed.
- The break: from 27 December price closed above the line, and the 2 January close of $89,995 was 5.5% above it. It rallied to $97,924 on 14 January.
- The failure: the rally did not hold. BTC slid back through the late-December lows, returned to the extended line in early February, and closed at $62,910 on 5 February, far below it.
The lesson: a break ends that trend line, but it does not prove a new uptrend. A buyer of the break with a stop under the breakout base (the 24 December low at $86,420) would have been stopped out on 25 January for a loss of about 4%, well before the crash. The stop, not the line, is what protected the account.
Where to Place Stops and Targets
- Stops go beyond the line and the swing point. A stop exactly on the line gets hit by normal wicks. Place it past the last swing low (long) or swing high (short).
- Size from the stop distance. Decide what you are willing to lose, then work out the position size from the distance to the stop. See how to calculate position size.
- Use the structure for targets. The previous swing high or low is the first target; the opposite line of a channel is the next. See channel lines.
- Move the stop with the line. A rising trend line climbs every day, so a trailing stop just under it locks in more of the trend.
More on placing exits: setting stop-loss and take-profit levels.
Common Trendline Trading Mistakes
- Forcing the line. Redrawing the line every time price closes through it means the trend line has broken; accept it.
- Trading the first touch. Two points always make a line. Without a third reaction, you are guessing.
- Treating one wick as a break. Crypto liquidations push wicks through obvious lines. Wait for a candle close beyond the line.
- Drawing on linear scale over long ranges. Large percentage moves distort lines on linear charts; use log scale for multi-month crypto trends.
- Ignoring the higher timeframe. A rising line on the 15-minute chart means little inside a daily downtrend. See using multiple time frames.
- Trading without a stop. As Example 2 shows, a clean break can still fail.
Trend Lines vs Channels vs Horizontal Levels
| Tool | What it shows | Best used for |
|---|---|---|
| Trend line | A rising or falling support or resistance that moves with the trend | Pullback entries and trend-change signals |
| Channel | A trend line plus a parallel line on the other side of price | Targets and range-within-trend trading |
| Horizontal level | A fixed price where buyers or sellers stepped in before | Breakouts, retests and take-profit levels |
Read more about how channel lines help and breakout trading strategies.
Trading Trend Lines With Altrady
Altrady puts the whole trend line workflow on one chart, connected to your exchange accounts:
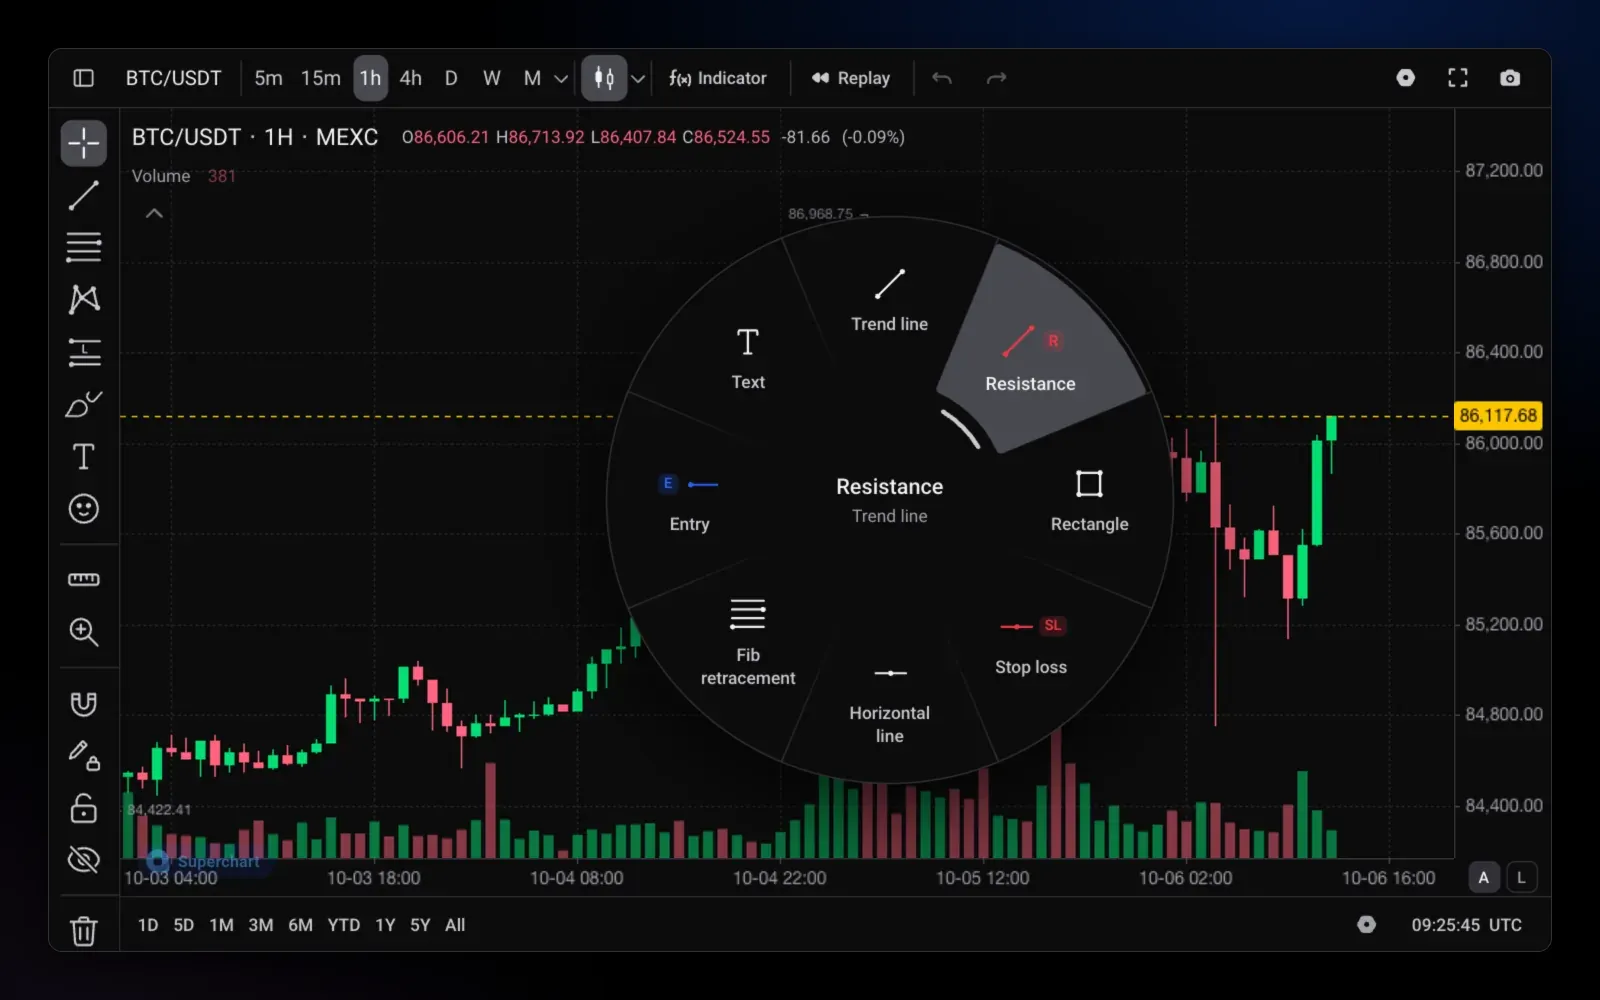
- Draw: open the drawing wheel in Altrady Charts and pick Trend line, then switch the chart to log scale for long crypto trends.
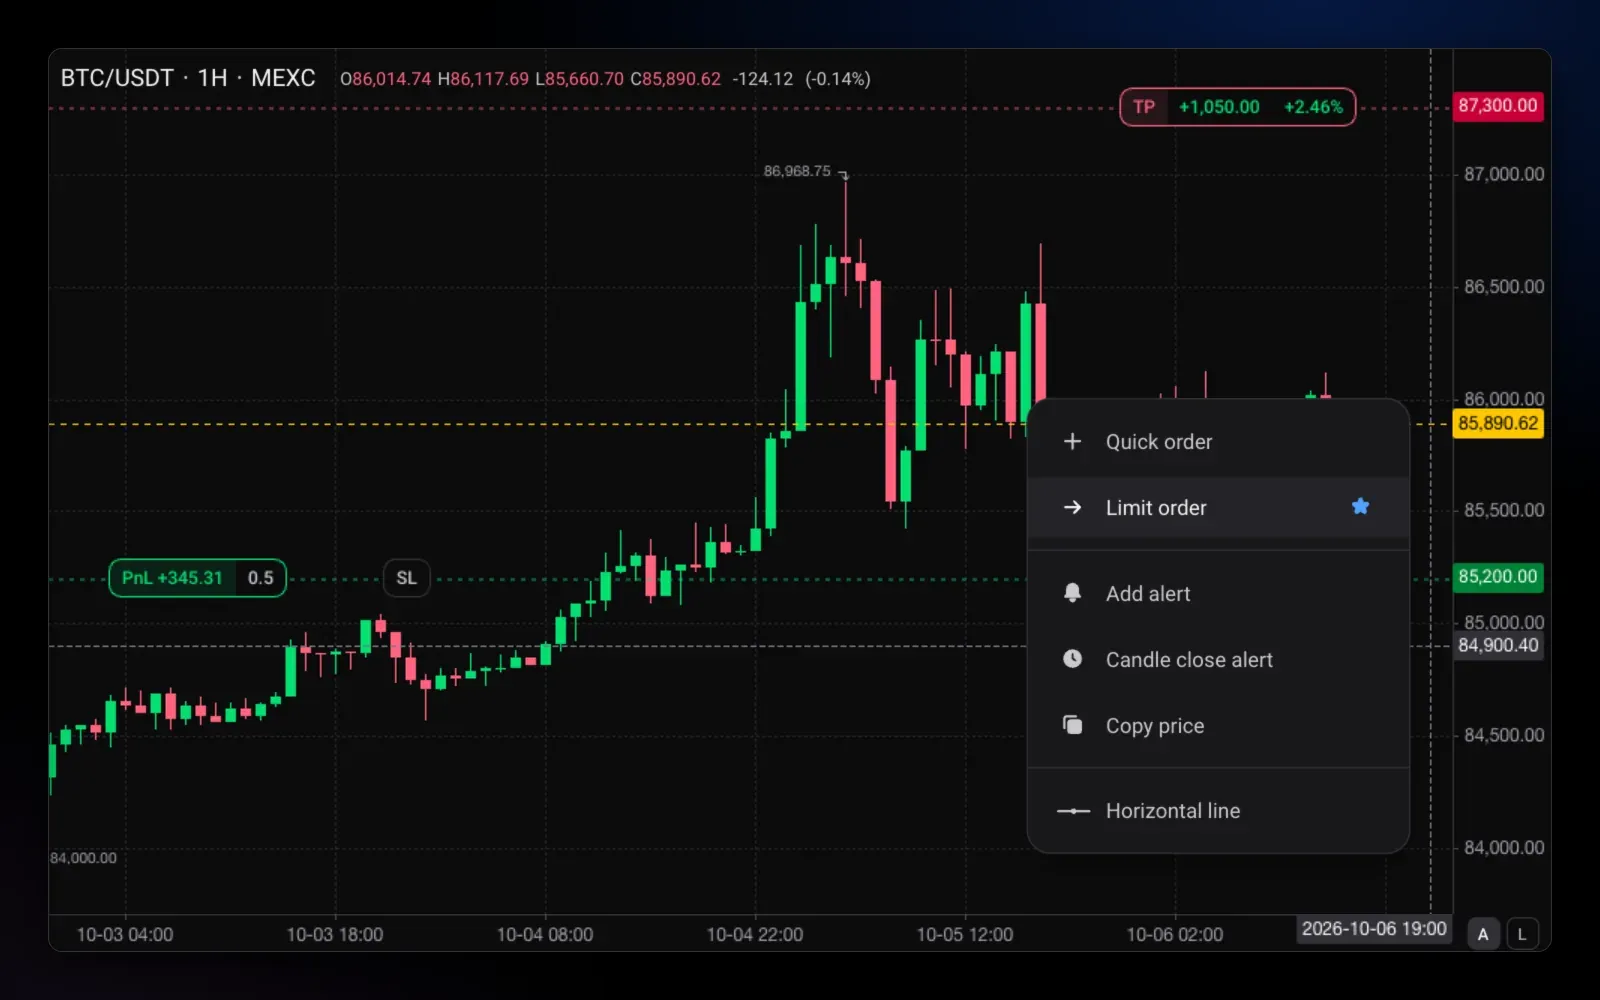
- Get alerted at the line: with trend line alerts, draw a trend line and get notified when price touches it, so you do not have to watch the chart for the third touch or the retest.
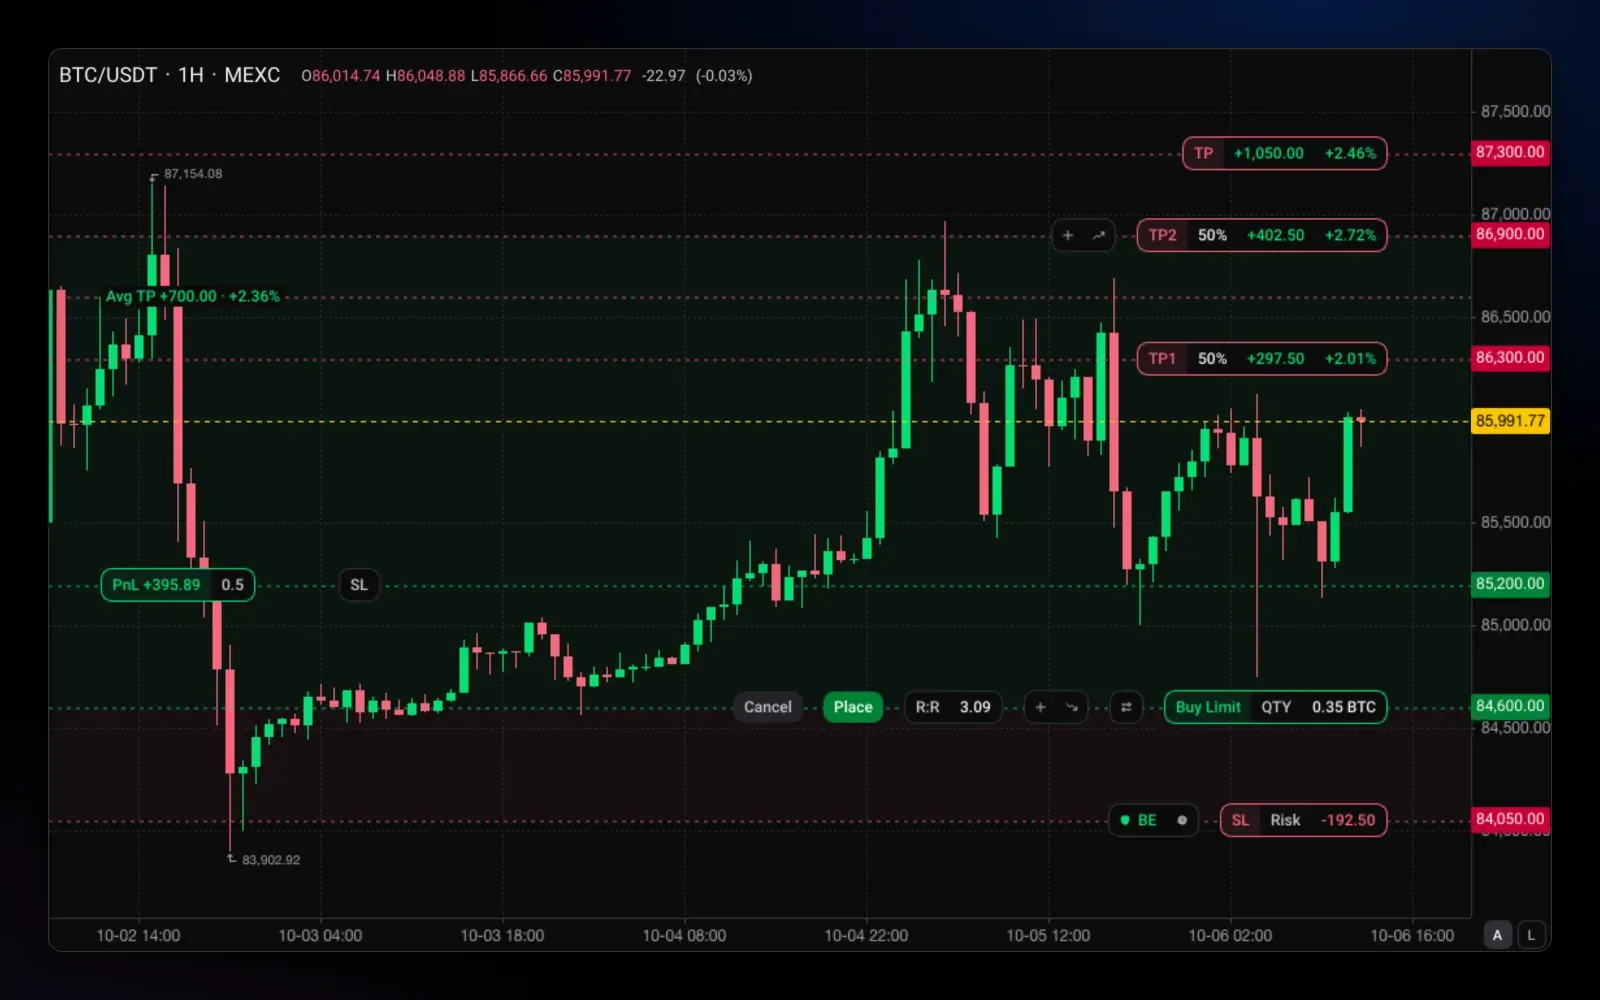
- Place the trade from the chart: set the entry, a stop beyond the line and take-profit targets in one smart order, sized from the share of your account you are willing to risk.
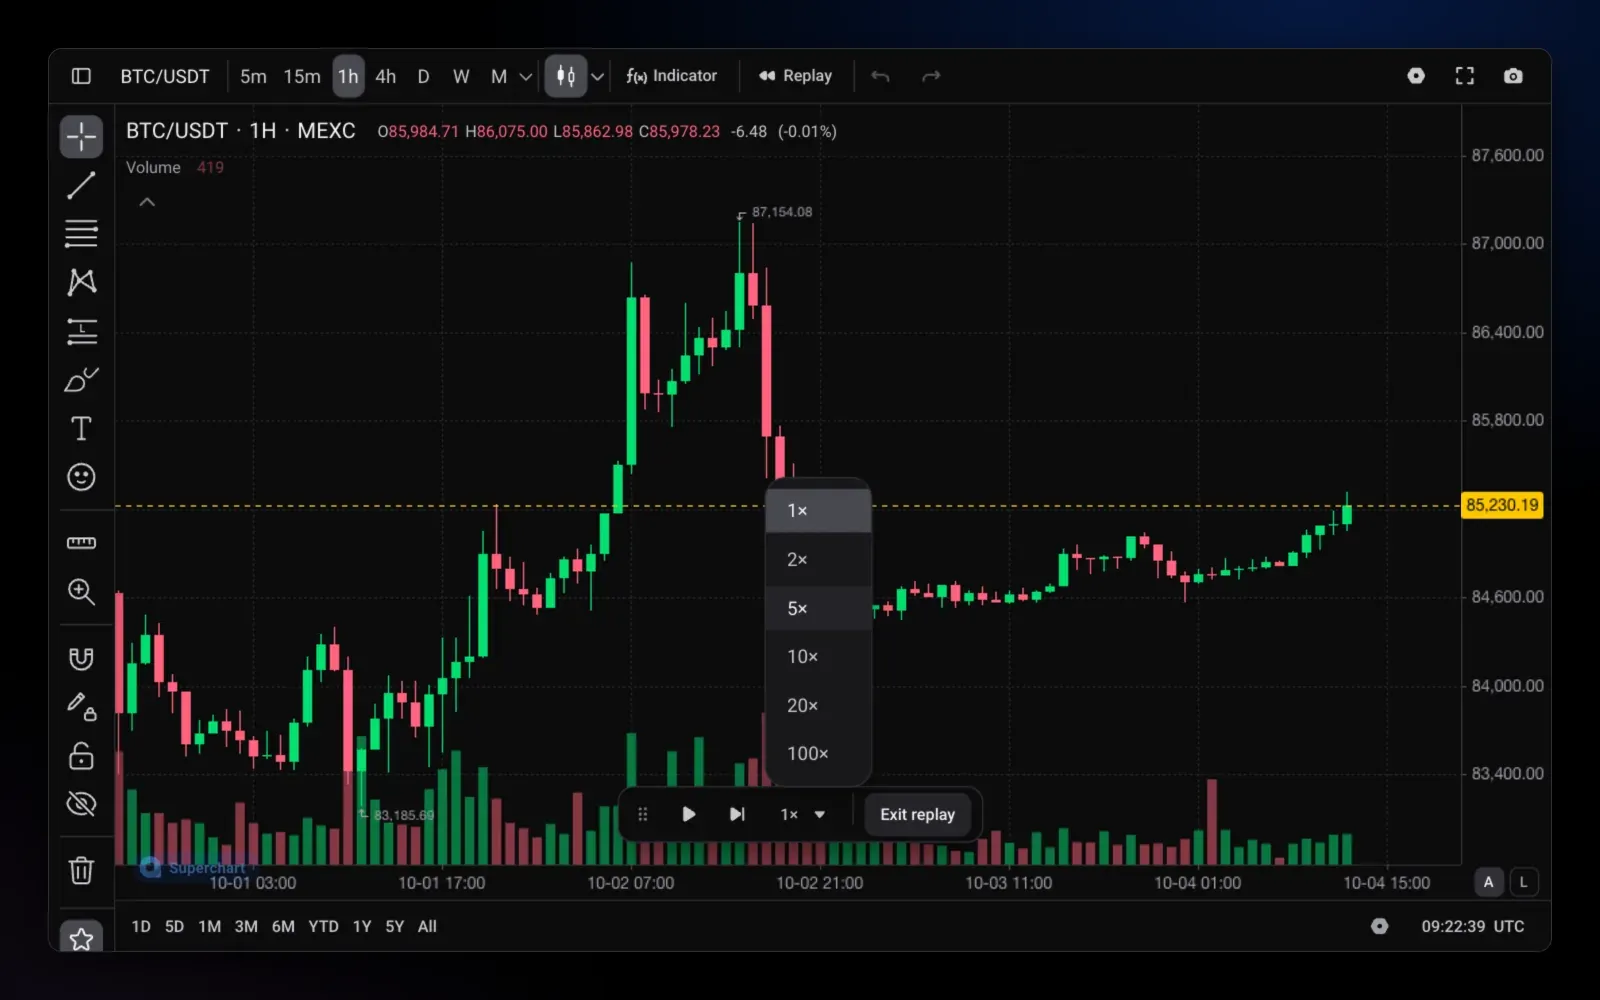
- Practise first: replay past price action bar by bar to practise drawing lines without seeing the future, or test setups on a paper trading account with simulated funds.
Watch the walkthrough on our YouTube channel, which covers drawing lines and avoiding false signals:
Frequently Asked Questions
Is trendline trading profitable?
It can be part of a profitable approach, but no setup wins every time. Trend lines give you defined entries and stops; profits depend on risk per trade, how often the setups work in the current market, and fees. Example 2 above shows a clean break that still failed.
How many touches make a valid trend line?
Two swing points draw the line and a third reaction confirms it. Each additional touch makes the line more watched, but also more likely to be broken eventually as the trend matures.
Should you draw trend lines on wicks or candle bodies?
Both are used; what matters is consistency. Many crypto traders anchor on wicks for the swing points and judge breaks on candle closes, because single wicks through a line are common during liquidations.
Which timeframe is best for drawing trend lines?
Lines on the daily and 4-hour charts are watched by more traders and hold more weight. Draw the main line there, then use a lower timeframe to time the entry at the line.
How do you confirm a trend line breakout?
Look for a candle close clearly beyond the line, higher volume on the break, and a retest that holds. A change in market structure, such as the first higher low after a downtrend, is the strongest confirmation.
Should you use a log or linear chart for crypto trend lines?
Use a log scale for trends that run over months or cover large percentage moves, which is most crypto trends. On short intraday charts the difference is small.
What is the difference between a trend line and a channel?
A trend line is one line along the lows or highs. A channel adds a parallel line on the other side of price, which gives you a target zone as well as the support or resistance.
Can you set an alert on a trend line?
Yes. In Altrady you can draw a trend line and set an alert that notifies you when price touches it, so you can wait for the third touch or the retest without watching the chart.