
A V pattern is a chart reversal where price falls sharply, prints a single low, then climbs back just as fast. A V bottom signals a possible bullish reversal, an inverted V a possible bearish one. Many traders treat it as confirmed only after a close above the neckline.
You have seen it happen: price crashes, bottoms out, then snaps back as if nothing happened. In crypto, where liquidations and 24/7 trading make sharp reversals common, it is one of the patterns traders watch most closely. This guide covers how to identify it, what it signals, and how traders approach it, along with its risks. It describes how traders read the pattern and is not trading advice.
What Is the V Pattern
The V pattern, also called a V-shaped reversal, is exactly what it sounds like: a sharp price decline followed by an equally sharp rebound, forming a “V” shape on the chart. It represents a shift in sentiment from panic selling to aggressive buying, often triggered by oversold conditions, short squeezes, or sudden news.
A coin that falls steeply for several sessions, prints one low, and recovers most of the drop in a similar number of sessions is the typical shape. The key characteristic is speed. Unlike a double or rounded bottom, a V forms no base at the low.
The inverted V, or V top, is the mirror image: a steep rally, one peak, then a sharp drop, read as a possible bearish reversal. See how traders approach the inverted V.
How to Identify It and Its Components
A true V pattern takes more than a bounce. The shape alone can fool you, because the price action inside it is what matters.
1. A Sharp, Vertical Decline
The first leg is the breakdown: an intense drop driven by fear, liquidations, or negative news. You’ll usually see:
- Large red candles
- High volume (panic selling)
- Price slicing through support levels
- RSI deep in oversold territory
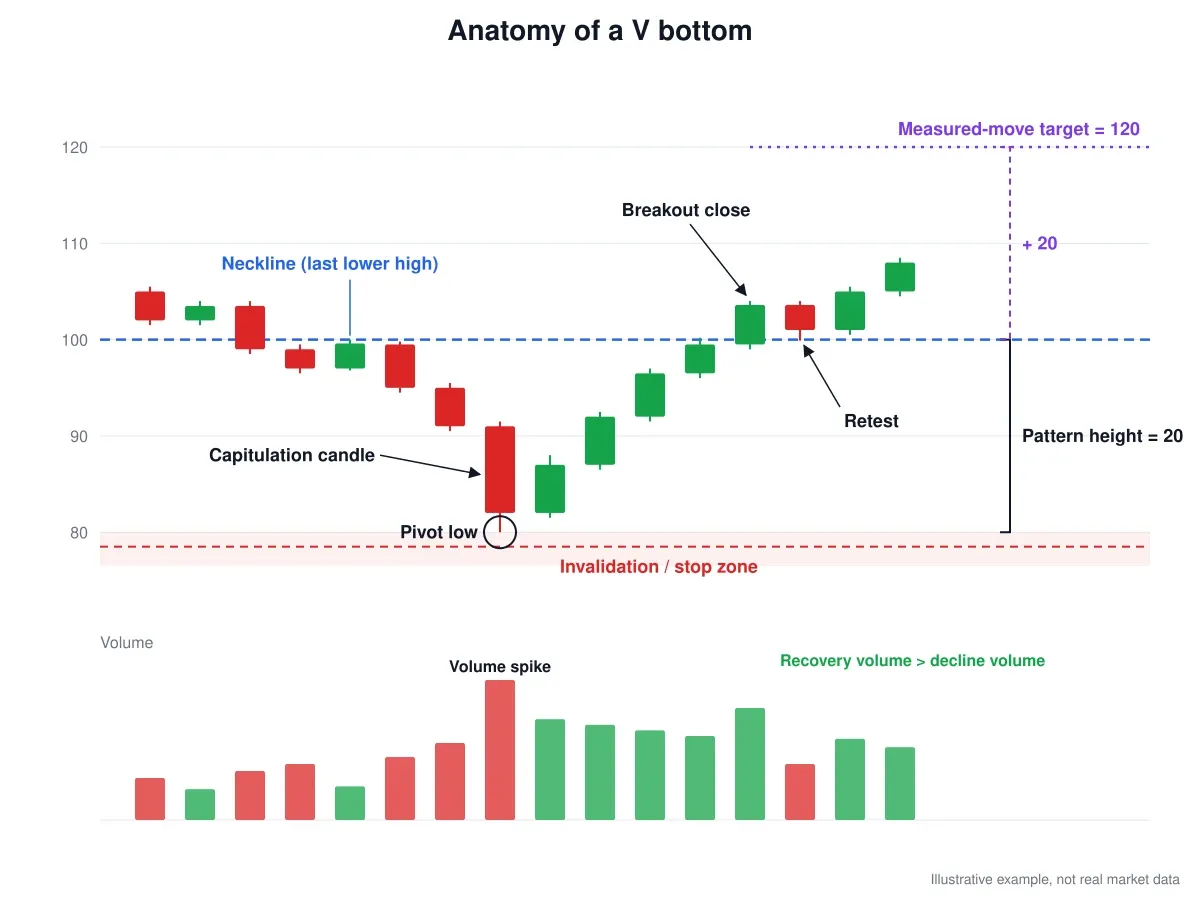
This leg often ends with a “capitulation” move: the last big flush where sellers dump at any price.
2. A Clean, Violent Reversal
After capitulation, price flips. Buyers step in, shorts start covering, and the market rises almost as fast as it fell. Key signs include:
- A big bullish candle (often engulfing several previous reds)
- Volume spike on the reversal
- RSI snapping upward from oversold zones
- Breaks of short-term resistance lines
This leg forms the right side of the V: the sign that sentiment has turned.
3. The Center Point (The “Pivot”)
This is the lowest point, where buyers overpower sellers. It often lines up with a support zone, a previous low, or a Fibonacci retracement level (like 61.8% or 78.6%). Some traders wait for a retest of this area before entering.
4. Volume Profile
The left side (decline) usually has rising sell volume. The right side (recovery) typically shows even stronger buy volume. Without that shift, the V might be a trap or just a temporary bounce.
5. The Neckline
The neckline is a horizontal line drawn at the last lower high before the final drop to the pivot low. It is the level the recovery has to reclaim. A close above it, ideally with recovery volume above the volume of the decline, is what many traders treat as confirmation. Without a clear lower high, some traders use the start of the final capitulation leg instead.
V Pattern vs Dead Cat Bounce vs Double Bottom
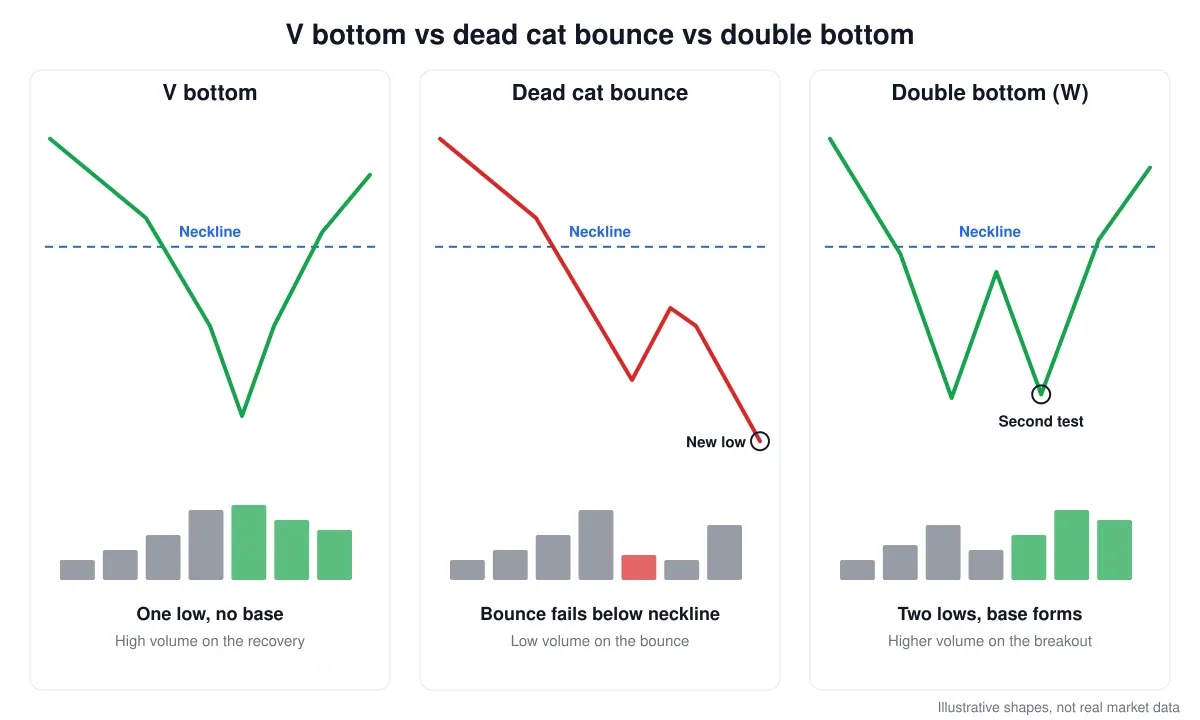
A sharp drop and a fast bounce can develop into three different patterns. Usually they only separate once the neckline has been tested.
| V bottom | Dead cat bounce | Double bottom | |
|---|---|---|---|
| Shape | One sharp low | Sharp low, weak bounce | Two lows at about the same level |
| Time at the low | Very short | Short | Longer, a base forms |
| Recovery volume | Higher than on the decline | Fading | Rising into the breakout |
| At the neckline | Closes above and holds | Stalls below | Breaks above after the second low |
| Invalidation | Price back below the pivot low | New lower low | Price below both lows |
Four checks traders use to separate a V from a dead cat bounce:
- The neckline is reclaimed on a closing basis.
- Recovery volume is stronger than decline volume.
- Price holds above the pivot low on a retest.
- A higher timeframe does not show the move as just a wick.
Pros and Cons of the V Pattern
Pros
- Early Trend Reversal Signal: It often marks the end of a downtrend and the start of a bullish phase, which is why it draws attention from traders looking for early entries.
- Strong Momentum: V patterns usually produce sharp price runs after the reversal, which swing traders often watch for.
- Clear Invalidation Point: The pivot low acts as a logical stop-loss zone. If price breaks below it again, the pattern is invalid.
- Works Across Timeframes: V patterns appear on 1-hour, daily and weekly charts. The logic stays the same.
Cons
- Hard to Catch in Real Time: The reversal is fast, and the pattern is often only clear after it has formed.
- False V’s (Fakeouts): Some “V” bounces are just dead cat bounces: temporary recoveries before another leg down.
- Emotionally Challenging: Entering during a panic is psychologically difficult, and many traders hesitate during the decline leg.
- Needs Volume Confirmation: Without strong reversal volume, the pattern can collapse quickly.
How to Interpret the V Pattern
A V bottom tells you that selling ran out abruptly rather than gradually. During the decline, forced sellers (stop losses, margin calls, liquidations) push the price far below where willing buyers sit. When that supply is gone, the price snaps back, often helped by short sellers buying to close.
Because the price spends almost no time at the low, there is no base of accumulation. Many buyers from higher up are still underwater, and they may sell as the price returns to their entry, so the neckline and the start of the decline are common areas of resistance. That is why retests and pauses after the breakout are common.
Timeframe matters too: a V on the 1-hour chart inside a daily downtrend says less than a V that reclaims a daily or weekly level.
Why V Patterns Show Up So Often in Crypto
Liquidation cascades: leveraged long positions are closed automatically as the price falls, which speeds up the drop and then leaves little selling pressure. Crowded shorts can then drive a squeeze on the way up.
24/7 trading: there are no overnight gaps, so a V forms in continuous candles, often over a weekend or during low-liquidity hours.
Wicks and exchanges: on higher timeframes a V is often one long-wicked candle, and the exact low can differ from one exchange to another depending on liquidity. The pivot, and any stop below it, is worth checking on the exchange where the order sits.
Context: funding rates, changes in open interest and liquidation data are often reviewed alongside the chart. None of them confirms a V on its own.
Trading Strategies Using This Pattern
Here are four ways crypto traders approach the V pattern, from conservative to aggressive.
1. The Confirmation Breakout Strategy
This is the most straightforward method and a common starting point for beginners.
- Traders wait for the V to fully form: sharp drop, clear bottom, sharp rebound.
- Mark the neckline: the last lower high before the final drop.
- The entry is taken after price breaks and closes above the neckline with volume.
Why traders use it: the breakout close suggests buyers have regained control and filters out some early fakeouts. The cost is an entry further from the low.
Stop-loss: commonly placed just below the pivot low.
Common target methods: the previous resistance zone, or a measured move. Measure the height from the pivot low to the neckline and add it to the neckline. Example in round numbers: neckline 100, pivot low 80, height 20, measured-move level 120. Price often stalls before or overshoots such levels, so traders treat them as reference zones rather than fixed outcomes.
2. The Retest Entry Strategy
Some traders prefer entering on a retest of the neckline after the breakout.
- Traders wait for a pullback to the broken neckline, which may now act as support.
- The entry is taken on bullish confirmation there: a bounce, a pin bar, or a higher low.
Why traders use it: the retest filters out some false breakouts and allows a tighter stop. Fast V reversals do not always retest, so the entry can be missed.
Stop-loss: commonly placed just below the retest level.
Common target methods: the same as above, a measured move or key resistance zones.
3. The Aggressive “Knife-Catch” Entry
This approach tries to time the low itself.
- Traders look for capitulation signs: large red candles, RSI below 25, panic volume.
- They look for a reversal candle (hammer, engulfing) or bullish divergence on RSI or MACD near major support.
- The entry is taken near the bottom, before confirmation.
Why traders use it: it aims for an entry close to the low, before confirmation.
The risk: catching a falling knife. If price does not bounce, losses build fast.
Stop-loss: commonly placed just below the recent low. Widening it after entry increases the potential loss beyond what was planned. This is the highest-risk entry of the four, because many sharp drops do not turn into a V at all.
4. The V-Pattern Short Strategy (Inverted V)
Everything works in reverse when the pattern flips upside down: an inverted V or V top. It can mark the end of an uptrend and the start of a sharp decline.
- A parabolic rally is followed by a sudden, sharp drop.
- A small bounce fails to reclaim the prior highs.
- Traders who short this setup typically enter as price breaks below the neckline or fails a retest.
Stop-loss: commonly placed above the recent swing high.
Common target methods: the pattern height projected downward from the neckline.
This version shows up most after hype-driven, parabolic rallies. Short positions carry their own risks, including theoretically unlimited loss if the price keeps rising, and funding costs on perpetual futures. A V top can also reverse sharply upward in a squeeze.
Tracking a V Pattern Setup in Altrady
Because V patterns form quickly, much of the work happens before the move. In Altrady, traders can set price alerts at the neckline and just below the pivot low, or draw a trend line alert along the neckline, and get notified in the app, on their phone or by email when a level is hit. Smart Trading lets one order hold the entry, a stop loss below the pivot and several take-profit targets such as the measured-move zone. Stop loss protection can trail the stop as price rises, move it to break even, or have it follow the take-profit targets. The Markets list can be filtered by 24h price change and volume range, and Quick Scan alerts can flag coins making unusually sharp moves. Multi-Charts puts several charts in one tab, so you can open the same pair on different exchanges side by side when their lows differ. Paper trading offers a way to rehearse the confirmation, retest and knife-catch entries without risking funds.
These tools help carry out a plan. They do not make the pattern more reliable.
Real-World Examples of the V Pattern in Crypto
Bitcoin’s March 2020 Crash
When COVID panic hit in March 2020, BTC fell from around $9,000 on 7 March to a low of about $3,800 on 13 March (Binance printed $3,782). It closed back above $7,000 on 6 April, one of the cleanest V-shaped reversals in Bitcoin history, and the recovery continued into the 2021 rally.
Ethereum’s Mid-2022 Recovery
After the Terra collapse in May 2022 and further stress in June, ETH fell from around $2,000 at the end of May to a low of about $880 on 18 June (Binance printed $882). It recovered to around $2,000 by mid-August, briefly topping $2,000 on 13 and 14 August. The recovery later faded, and during the FTX collapse ETH dropped back toward $1,000, hitting about $1,075 on 9 November 2022. That is a reminder that a V reversal on one timeframe does not settle the larger trend.
Tips for Trading the V Pattern Effectively
- Volume confirmation: a recovery on weak volume is more often a bounce than a reversal.
- Multiple timeframes: a V on the 4-hour chart can look like noise on a higher timeframe, so traders compare both.
- Late entries: chasing after a fast move widens the distance to the stop and changes the risk/reward.
- Trailing stops: some traders trail stops because V reversals can overshoot and then retrace.
- Indicators: RSI divergence, MACD crossovers and moving averages are commonly used alongside the pattern.
Frequently Asked Questions
Is the V pattern bullish?
A V bottom is usually read as a bullish reversal: selling pressure runs out at one low and buyers push the price back up quickly. An inverted V, or V top, is the bearish version. Neither is guaranteed. Many apparent V bottoms turn out to be dead cat bounces that stall below the neckline and then make new lows, so traders tend to look for a close above the neckline, stronger volume on the recovery, and the price holding above the pivot low before treating it as confirmed.
What is the difference between a V bottom and a dead cat bounce?
Both start with a sharp drop and a quick bounce. In a V bottom, the recovery reclaims the neckline (the last lower high before the low) on rising volume and holds above it. In a dead cat bounce, the rebound stalls below the neckline, volume fades, and the price goes on to make a lower low. Usually you can only tell them apart after the neckline has been tested.
What is an inverted V pattern?
An inverted V, or V top, is the mirror image of a V bottom: a steep rally, a single peak, then a sharp drop. It is read as a possible bearish reversal, often after a parabolic or hype-driven rise. Traders usually watch for a close below the neckline, and for a failed attempt to reclaim it, before treating it as confirmed. The short strategy section of this article describes how traders approach it.
Which timeframe is best for spotting a V pattern?
V patterns appear on every timeframe, from minute charts to weekly charts, and the logic is the same. What changes is the context. A V on the 15-minute chart may be a single wick on the 4-hour chart, while a V on the daily chart can mark a bigger shift. Many traders spot the pattern on one timeframe and check one timeframe above it to see whether the move stands out or is just noise.
Final Thoughts
The V pattern captures a sudden change in who controls the market: forced selling runs out and buyers return fast. Its speed is both its appeal and its main risk, because many sharp bounces never reclaim the neckline.
Traders who use it tend to rely on the same signals: a close above the neckline, stronger recovery volume, a clear invalidation level below the pivot, and context from a higher timeframe. Practising those checks in paper trading before applying them to a live market is one way to learn how the pattern behaves.